Is the stock market in a bubble right now?
Are we in a bubble right now that's about pop? Well, there's some known indicators that flagged during previous bubbles just before crashes. So I made this page that shows live bubble indicators so you can judge for yourself:
What each one means
Valuation: how expensive are stocks vs fundamentals?
- Shiller CAPE ratio: price ÷ 10-year average inflation-adjusted earnings. The best long-run return predictor that exists: a high CAPE has historically meant weak returns over the following decade. Long-term average is ~17.
- Buffett Indicator: total US stock market value ÷ GDP. Warren Buffett called it "probably the best single measure of where valuations stand"; above ~150-200% is "playing with fire."
- Tobin's Q: market value of companies ÷ what it would cost to rebuild them (replacement cost). Long-run mean is ~0.75; above 1 means the market prices companies above their tangible worth.
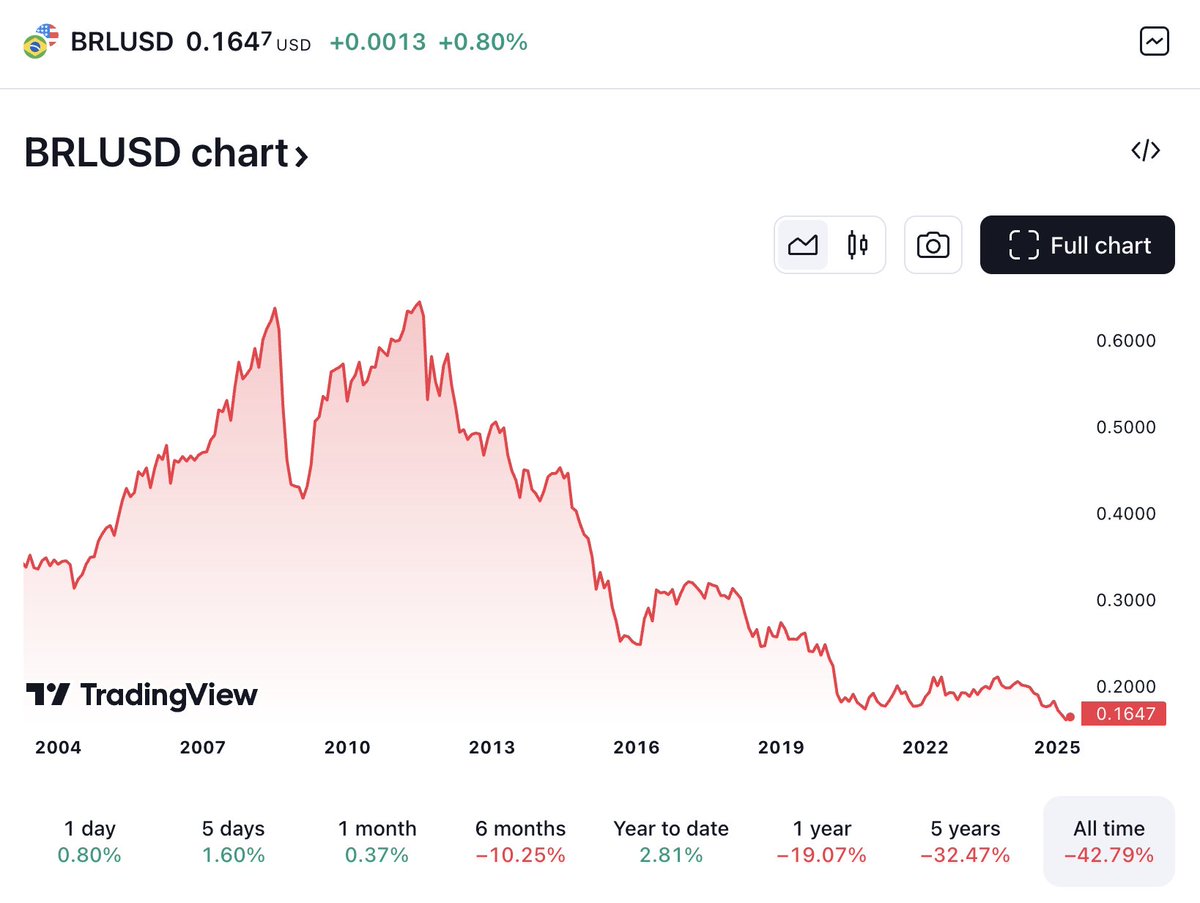
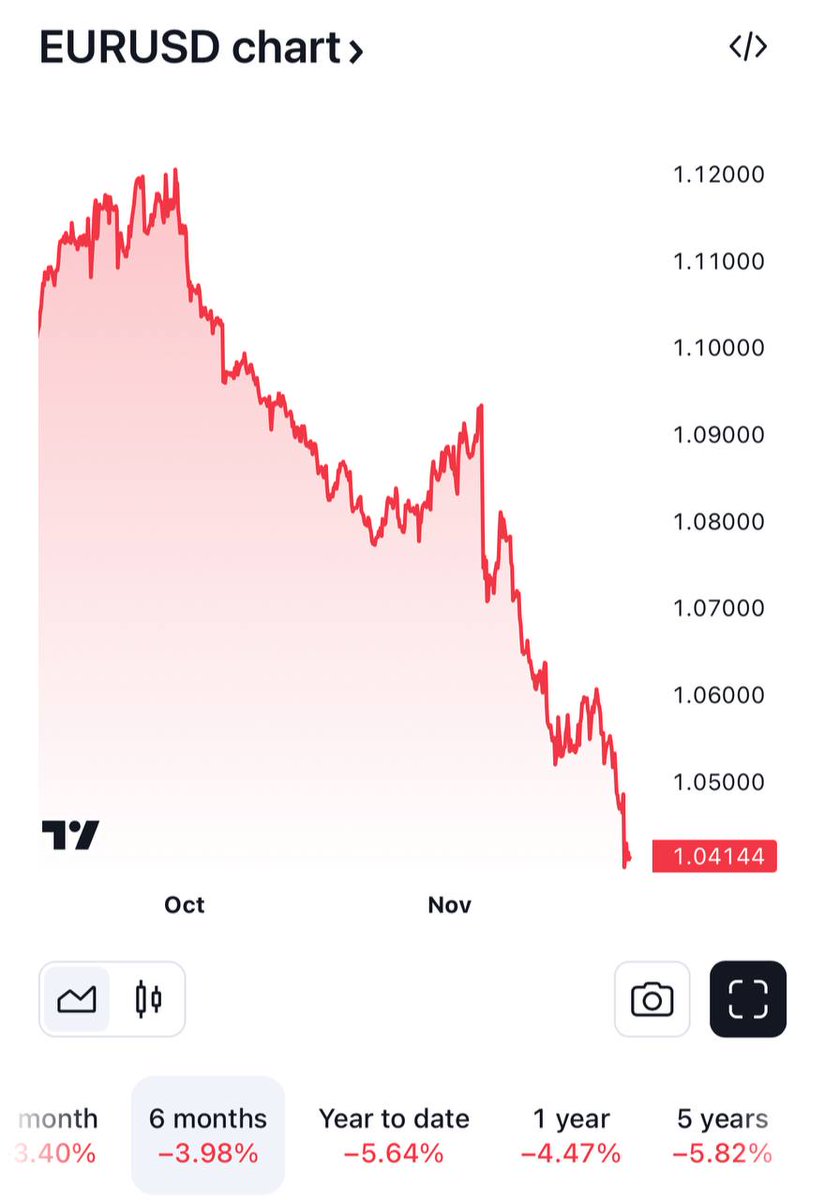
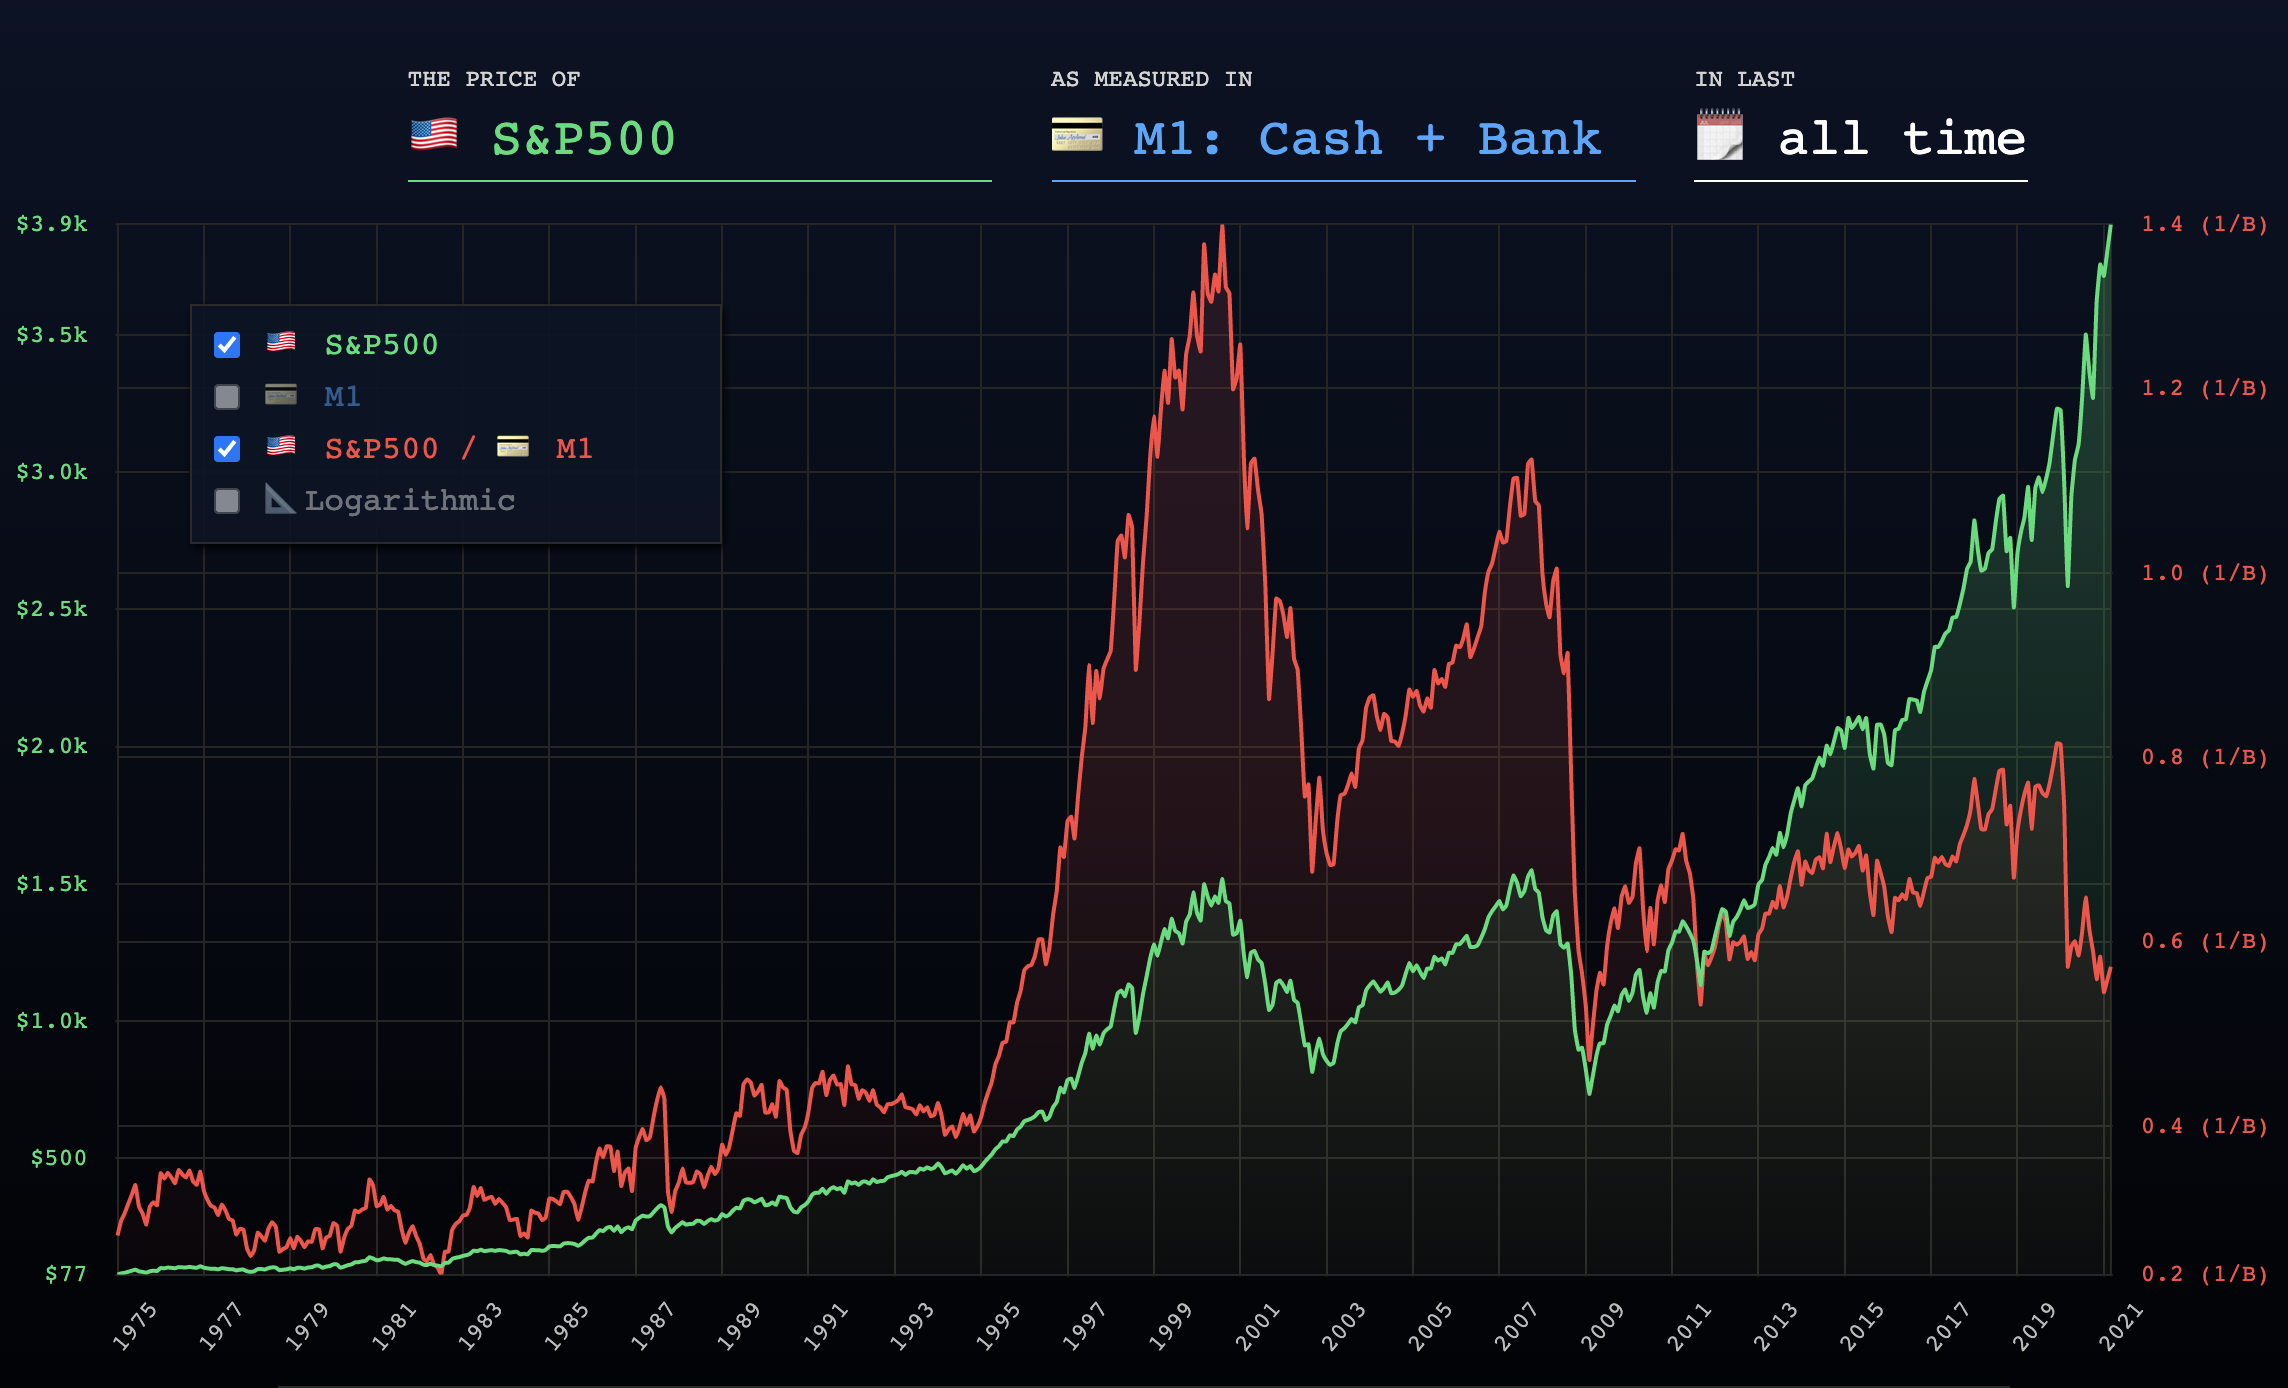
- S&P 500 ÷ M2: valuation adjusted for the money supply, so "record highs" that are really just monetary inflation don't fool you.
Complacency & credit: is everyone pricing in zero risk?
- VIX: the "fear index." A very low VIX means investors are complacent, a classic late-bubble tell; spikes mean fear.
- High-yield credit spread: the extra yield junk bonds pay over Treasuries. Very tight = lenders pricing in almost no risk (froth); widening = stress building.
Macro: is a recession brewing underneath?
- Yield curve (10y-2y): an inverted curve is the most reliable recession lead indicator. Recessions usually hit after it un-inverts (the window we're in now), not during the inversion itself.
Everything above updates itself from public data a few times per day.
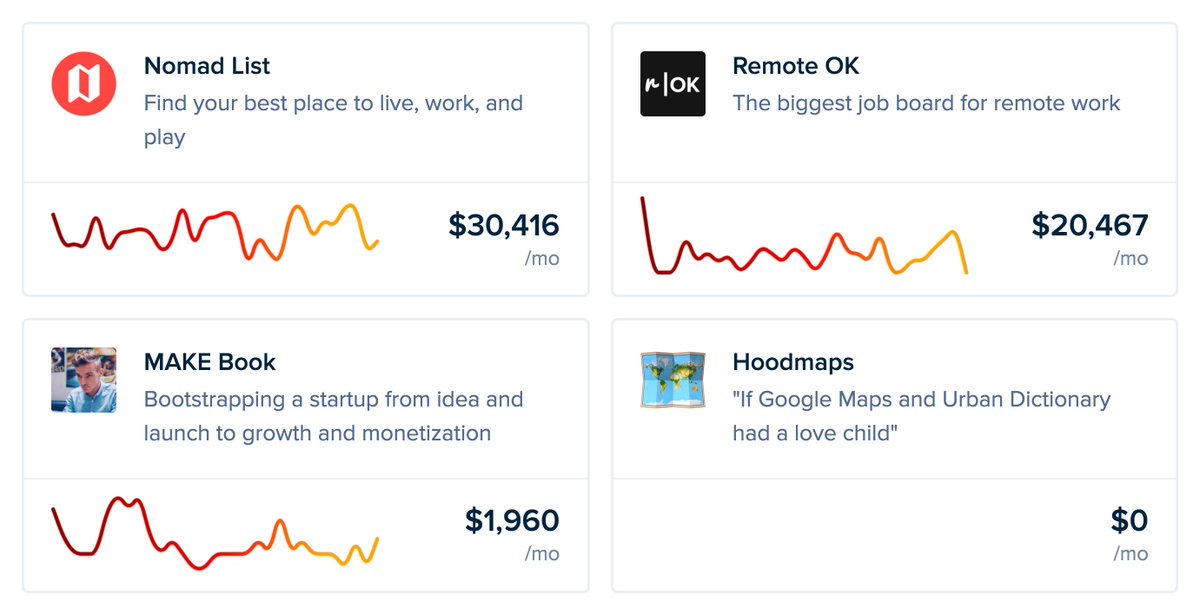
P.S. I'm on 𝕏 too if you'd like to follow more of my stories. And I wrote a book called MAKE about building startups without funding. See a list of my stories or contact me.
To read every new post (including blogs from 𝕏) in full in your inbox, join 14,331 subscribers
You can unsubscribe easily and I promise to never spam you