Building a startup in public: from first line of code to frontpage of Reddit
I show how I built a mini startup called Hoodmaps in public from the first line of code to a functioning web app that I got to the frontpage of Reddit with over 300,000 people using it. While recording the entire process on Twitch and Twitter.
(This post is gigantic, click through to build, launch, post-launch and conclusion.)
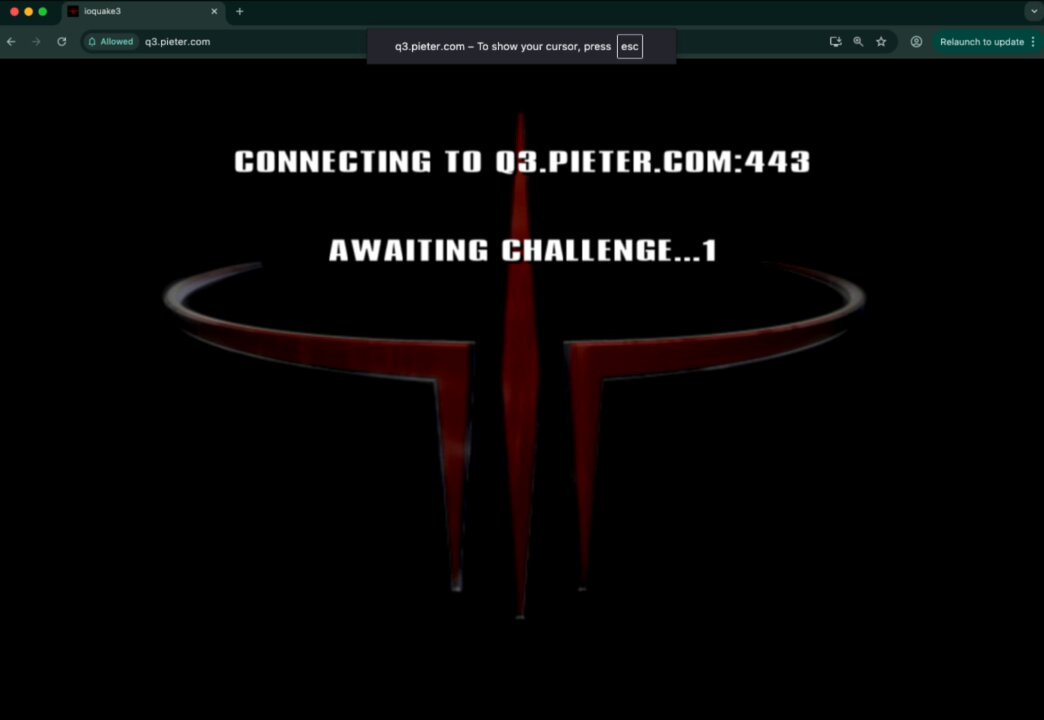
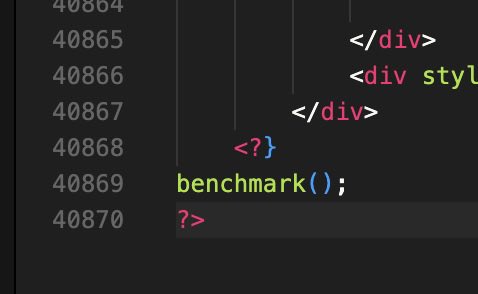
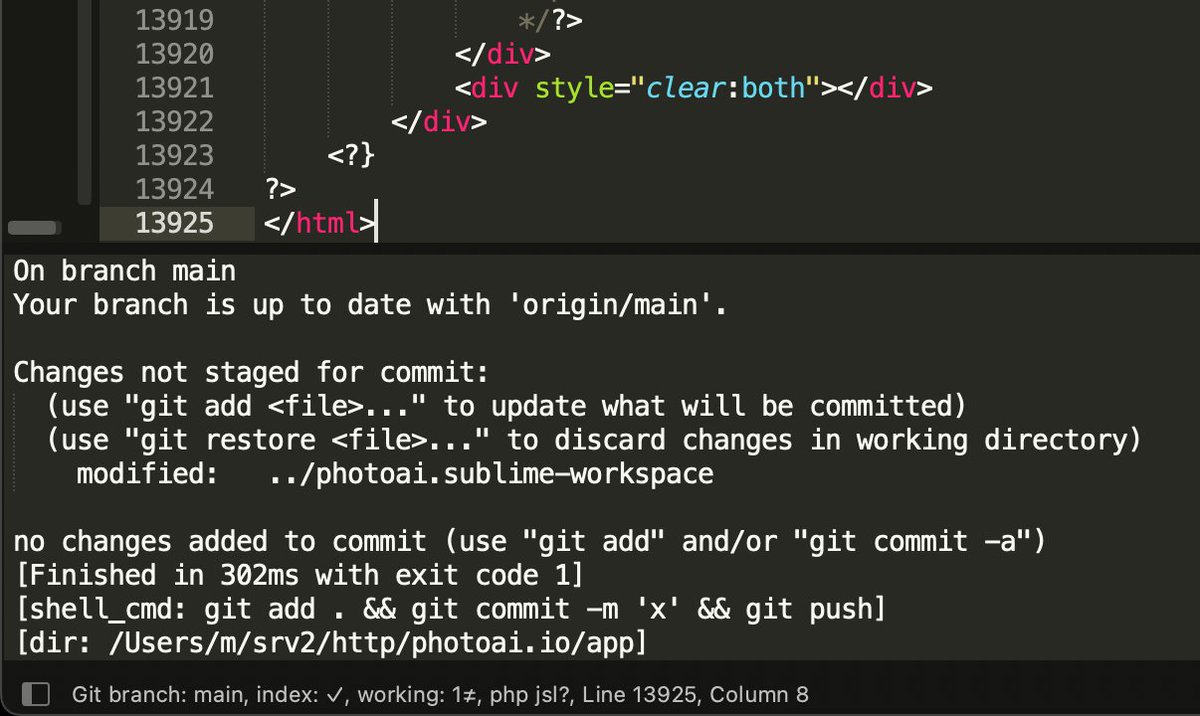
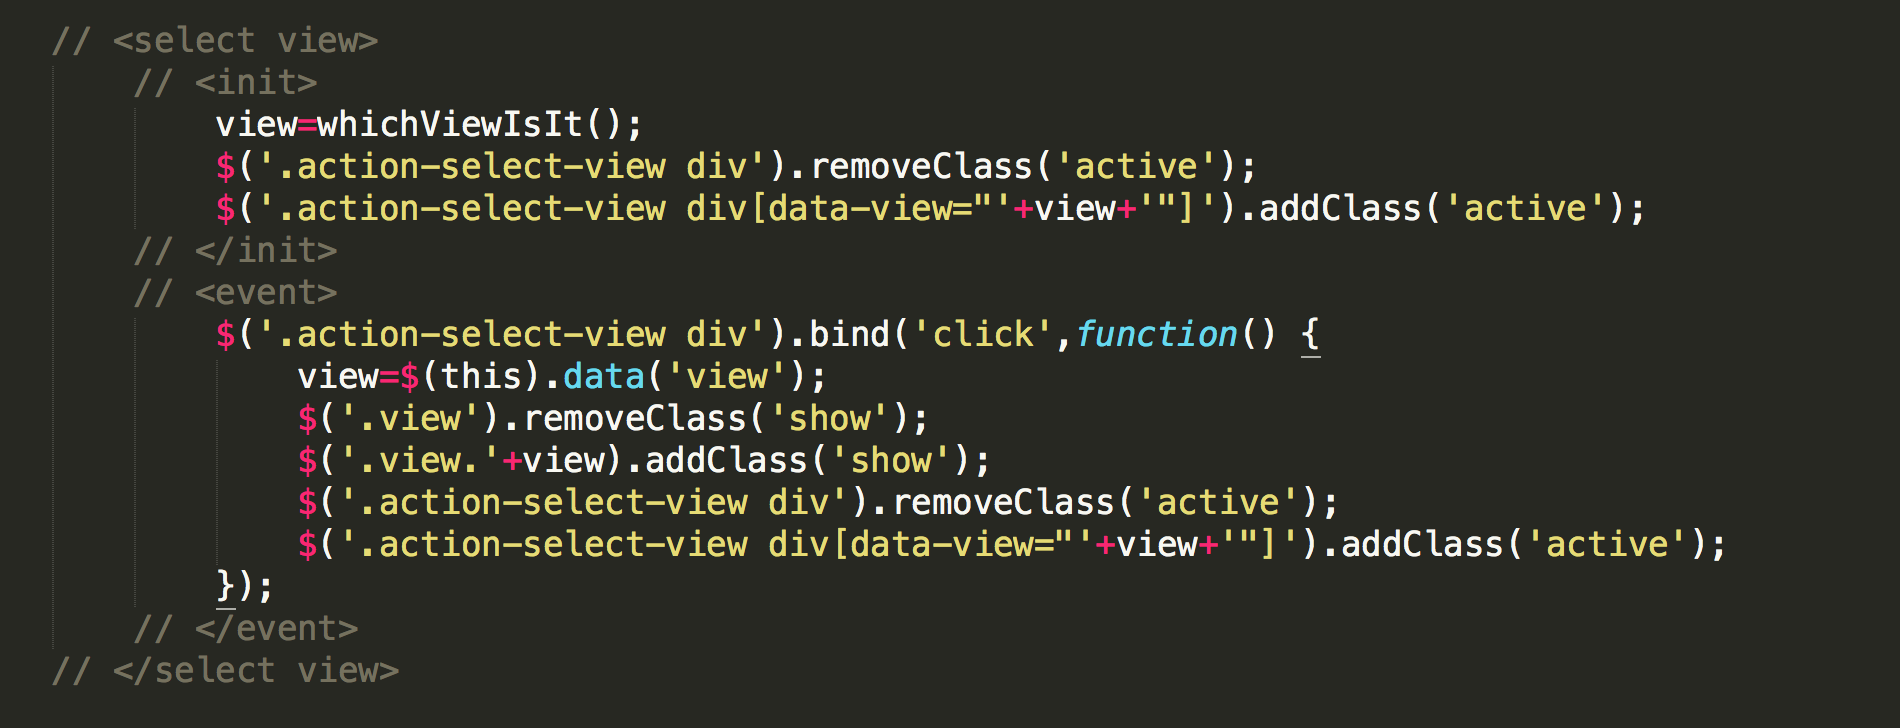
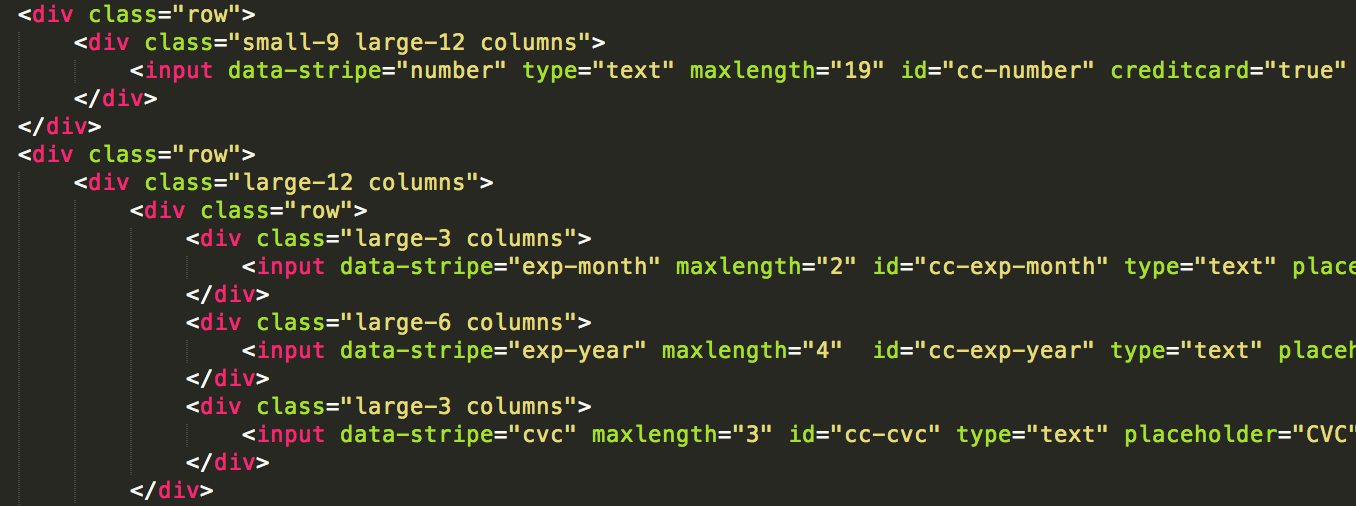
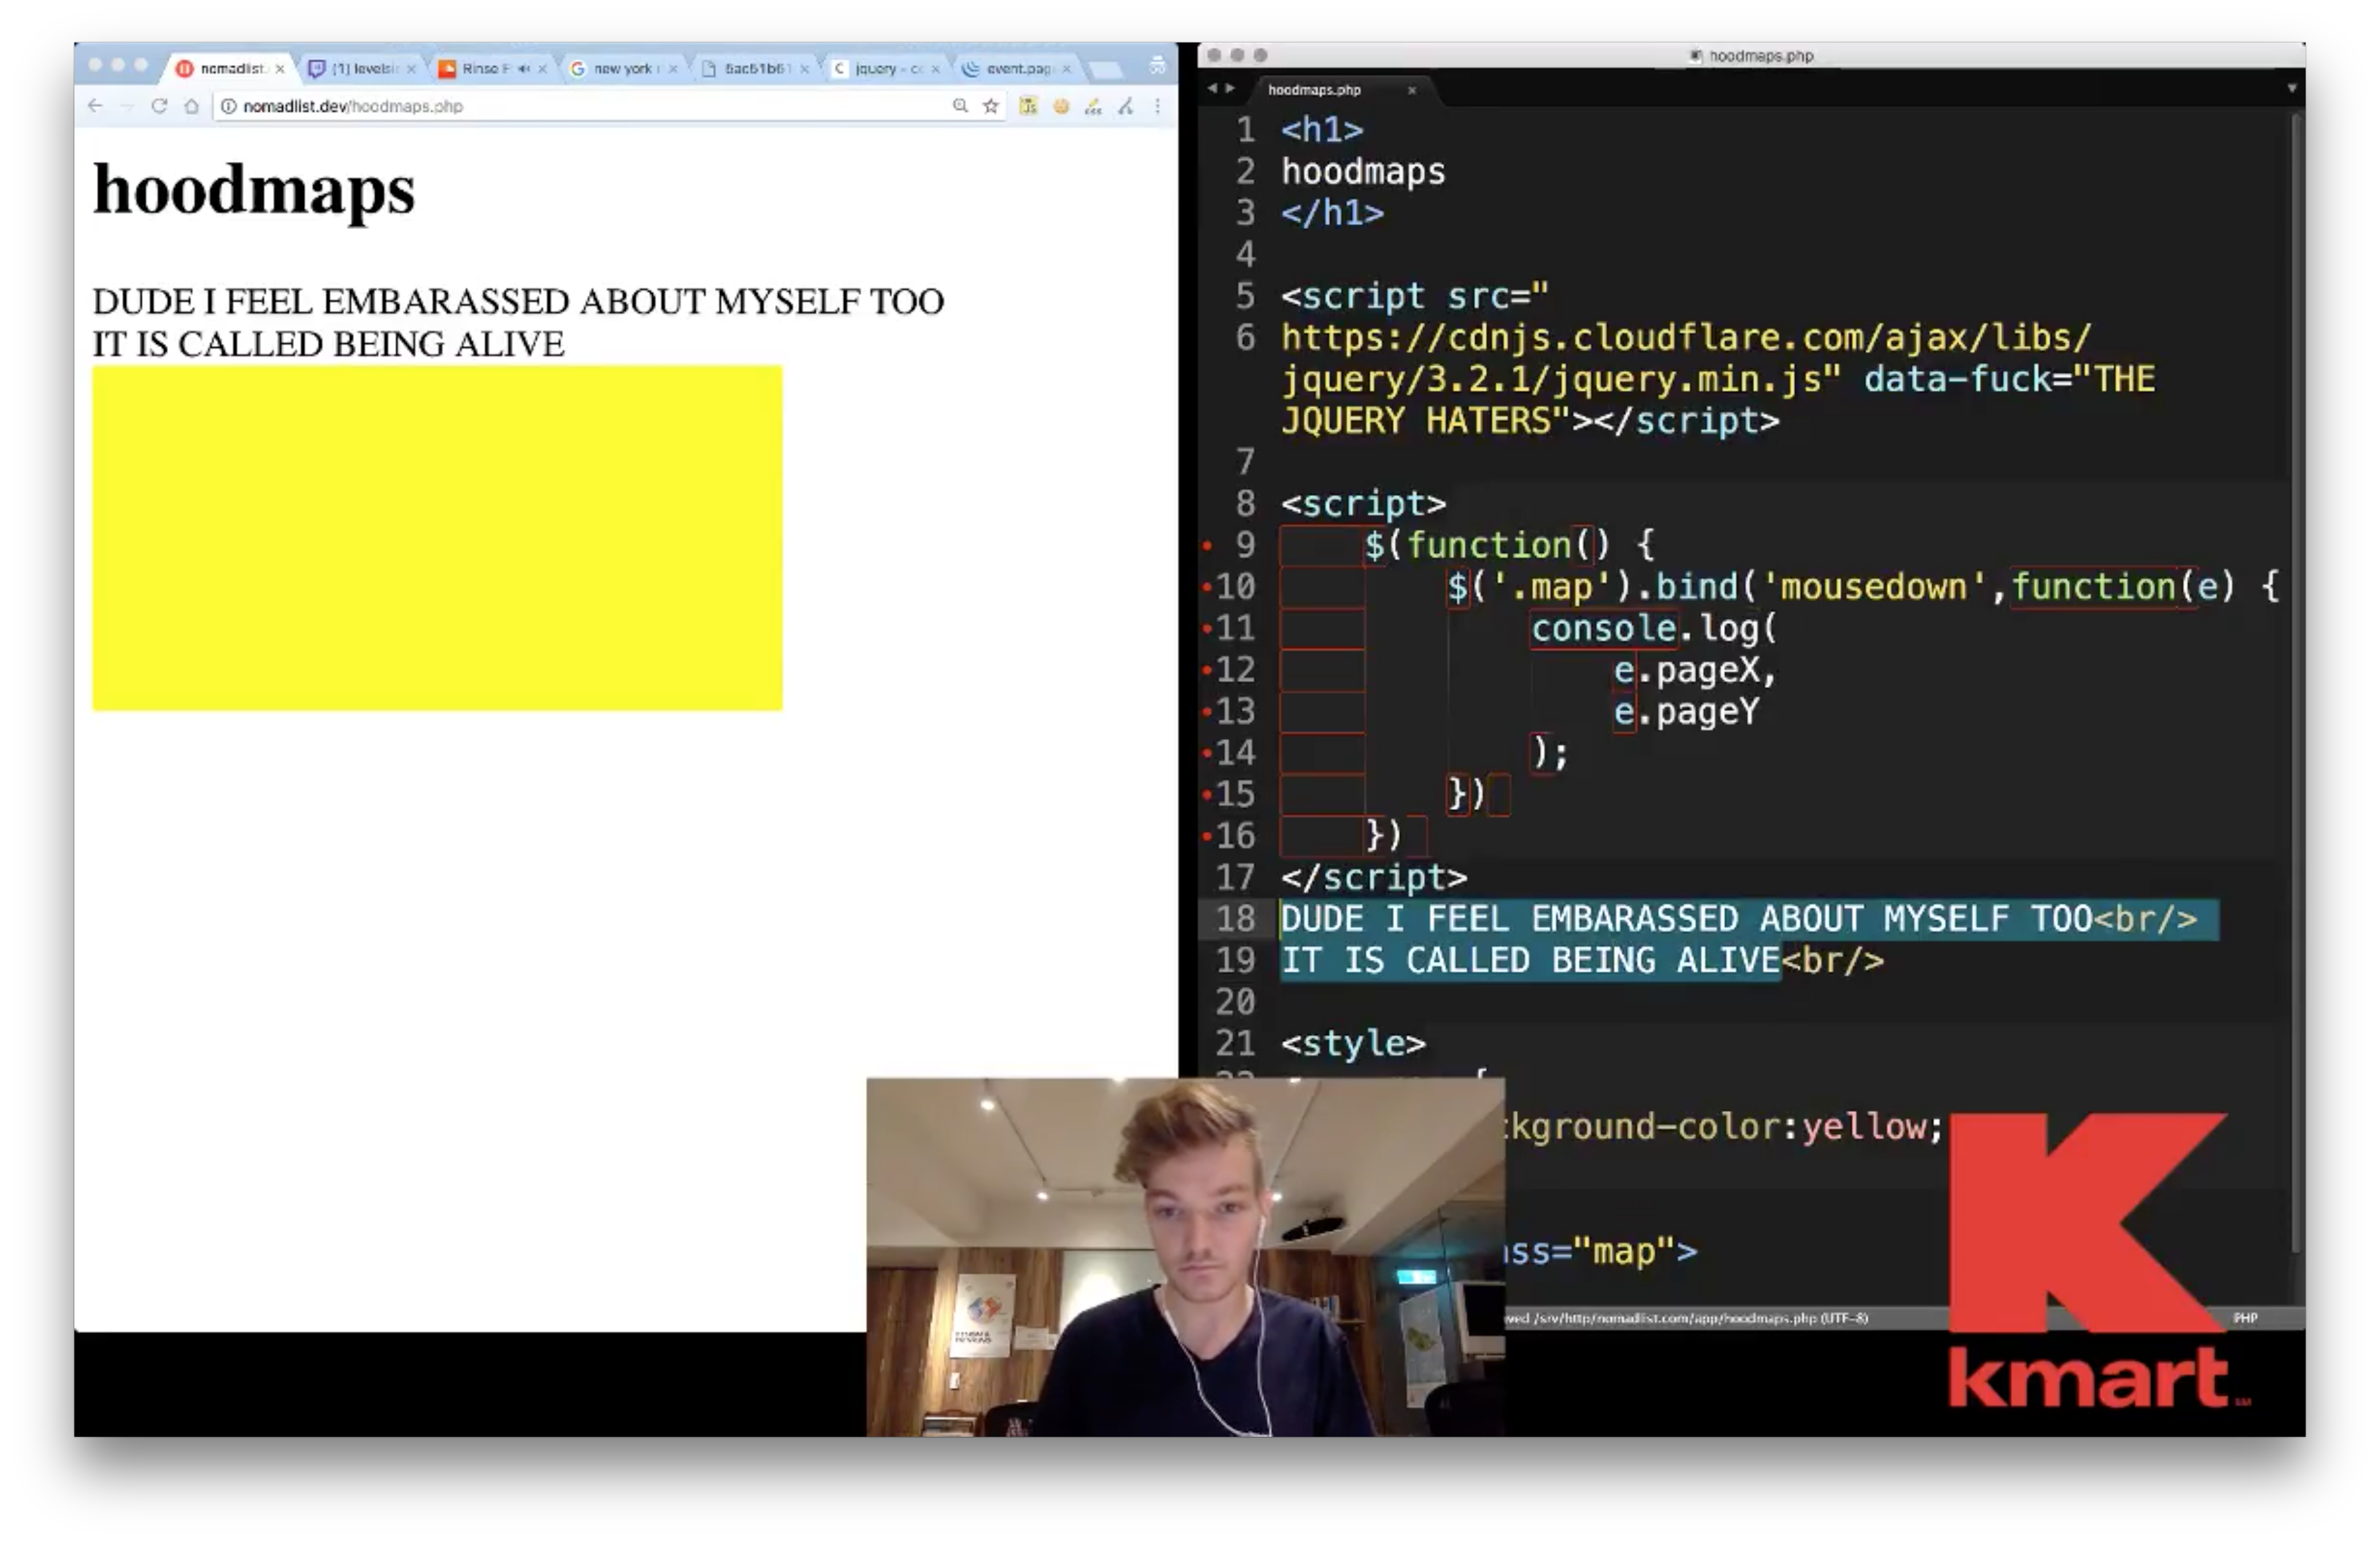
We go from first line code:
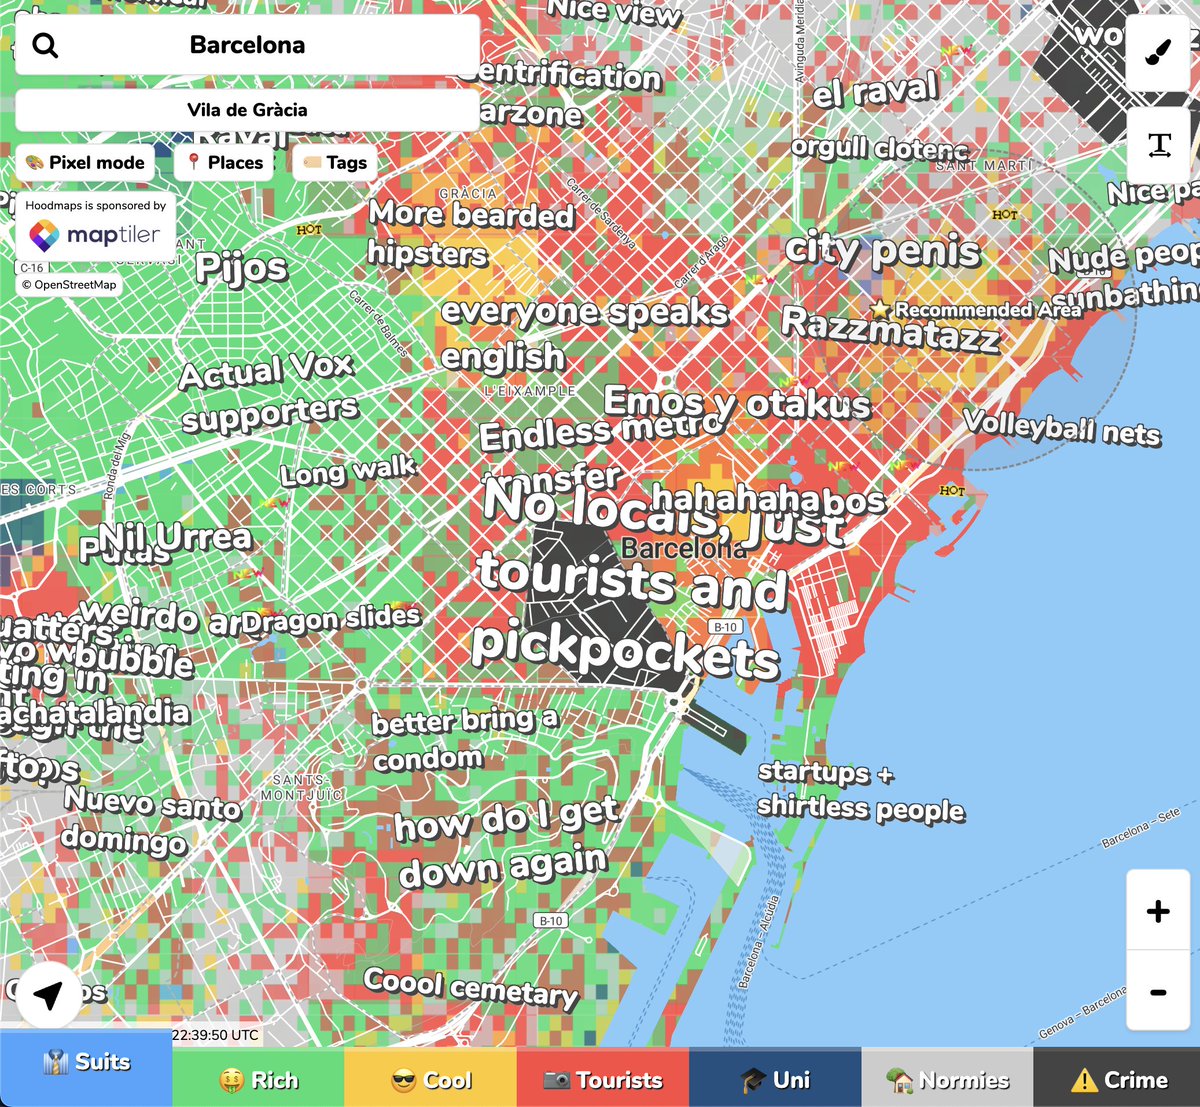
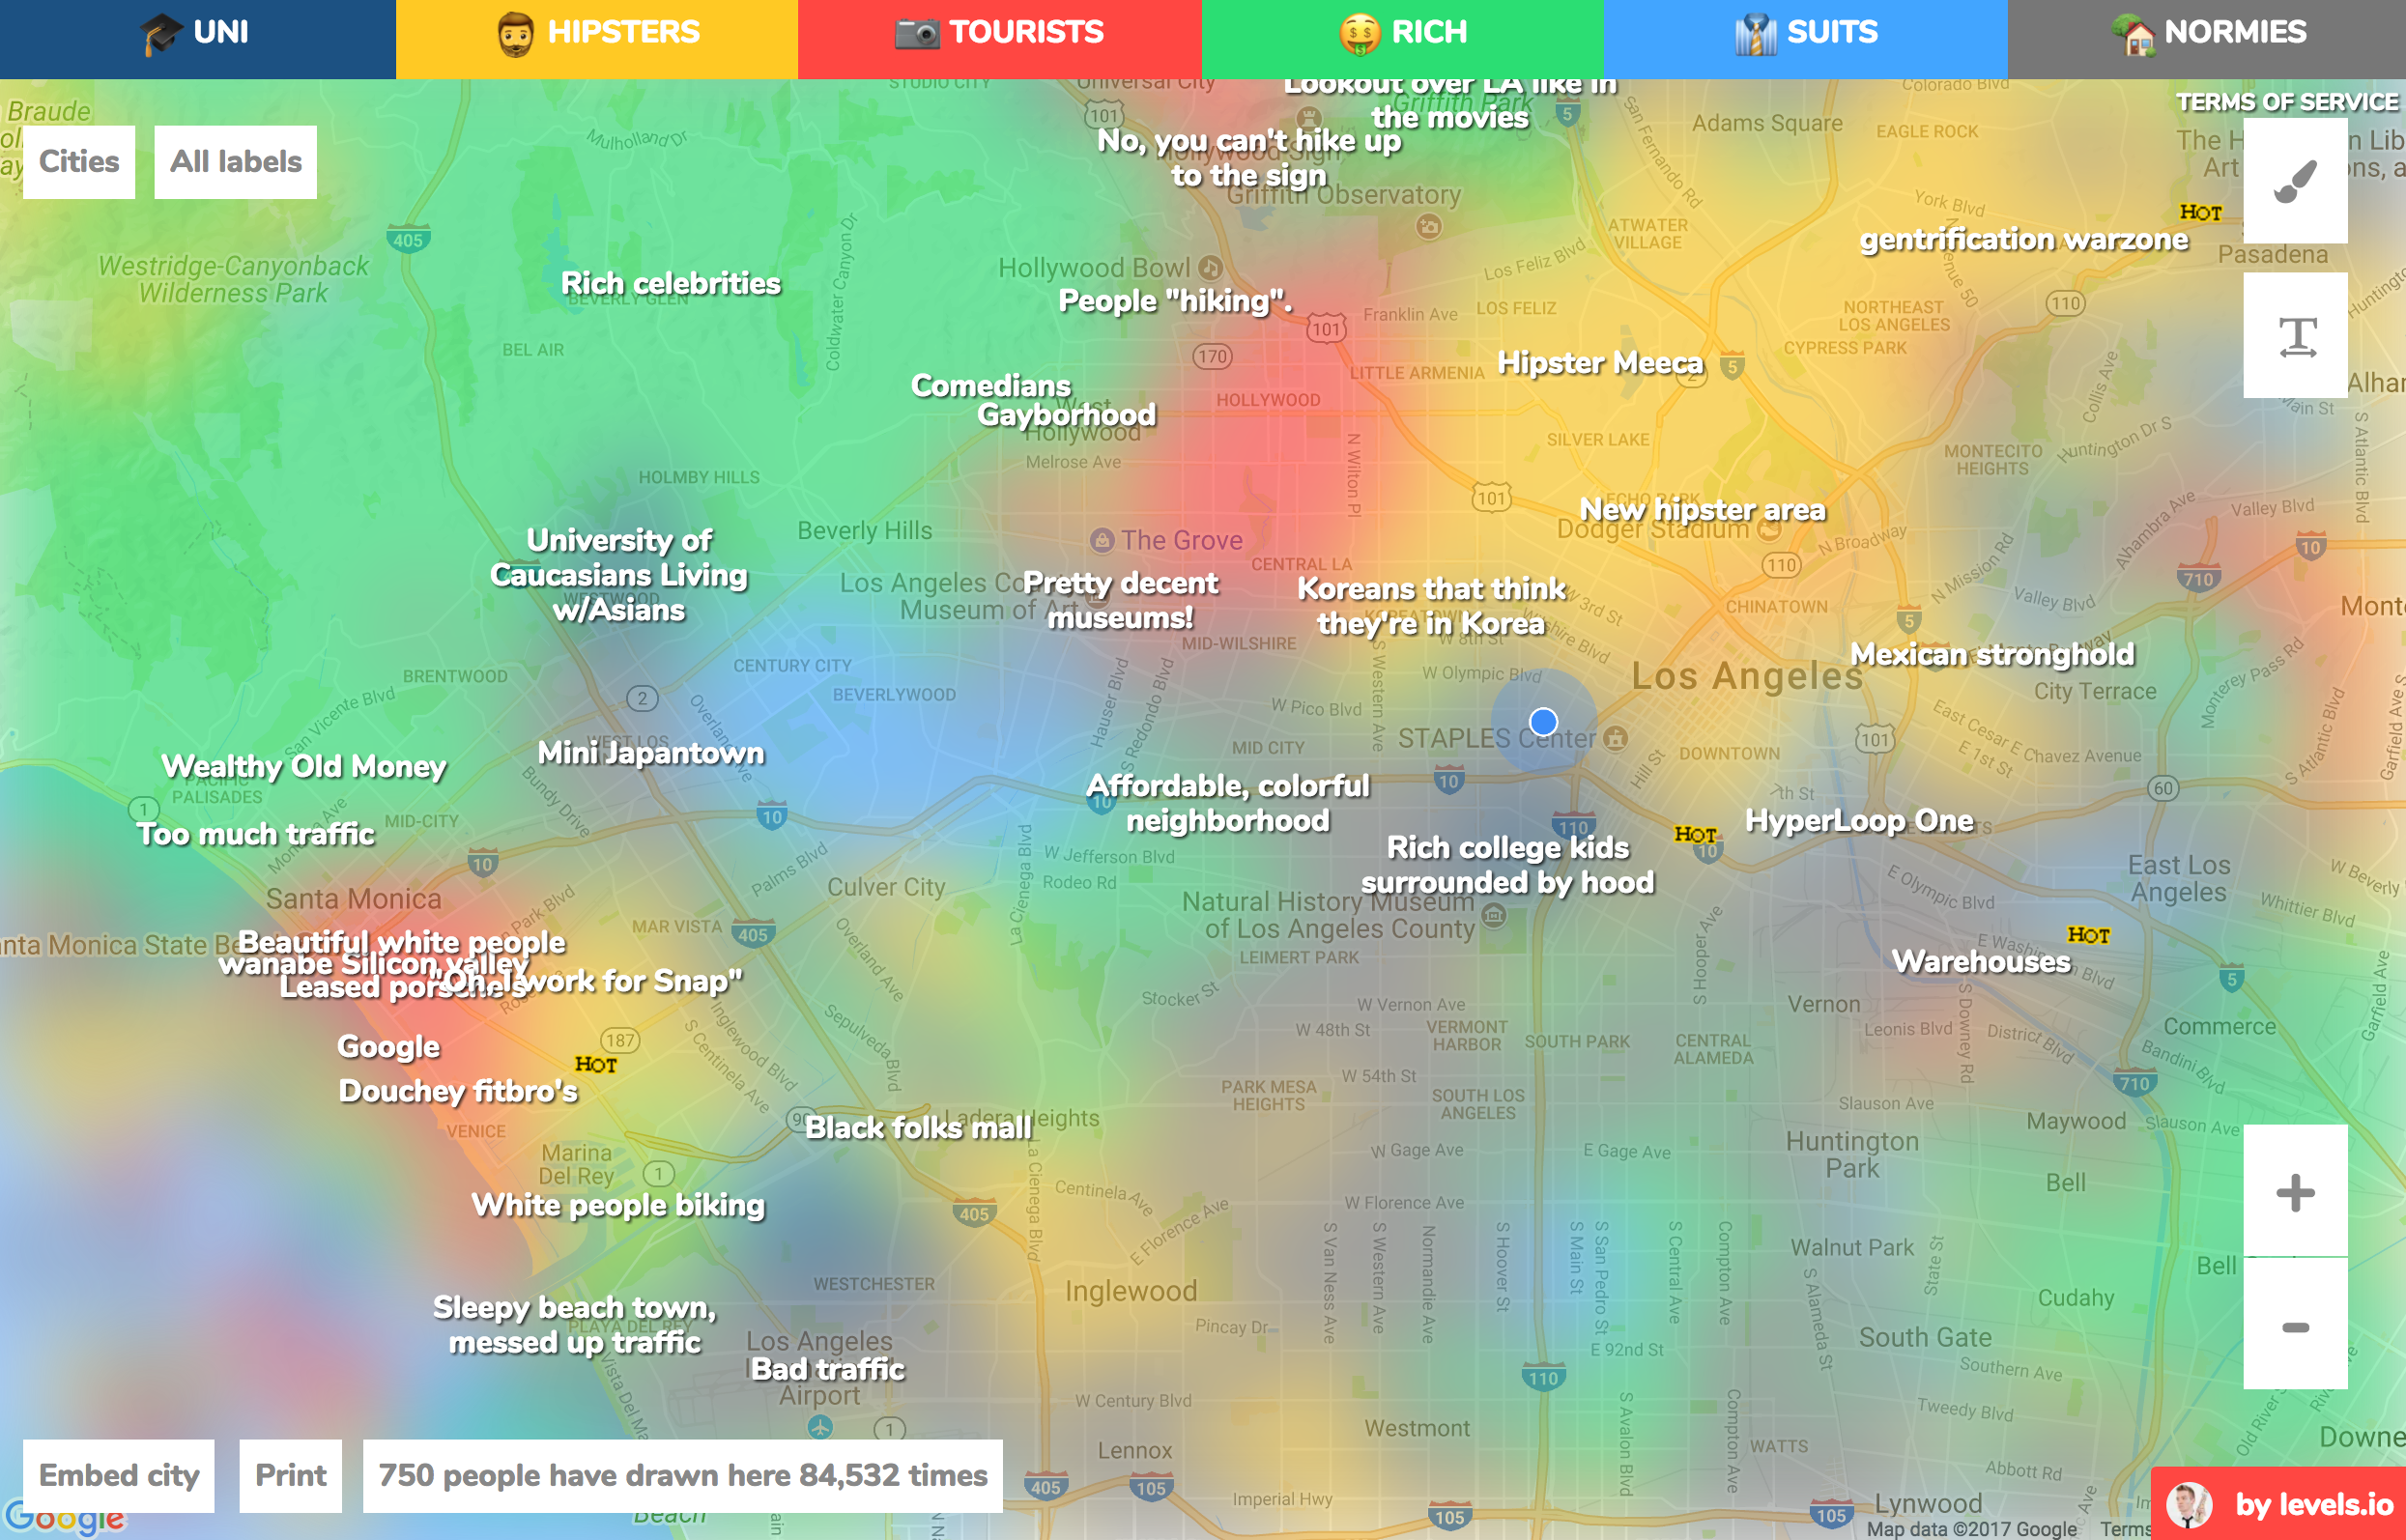
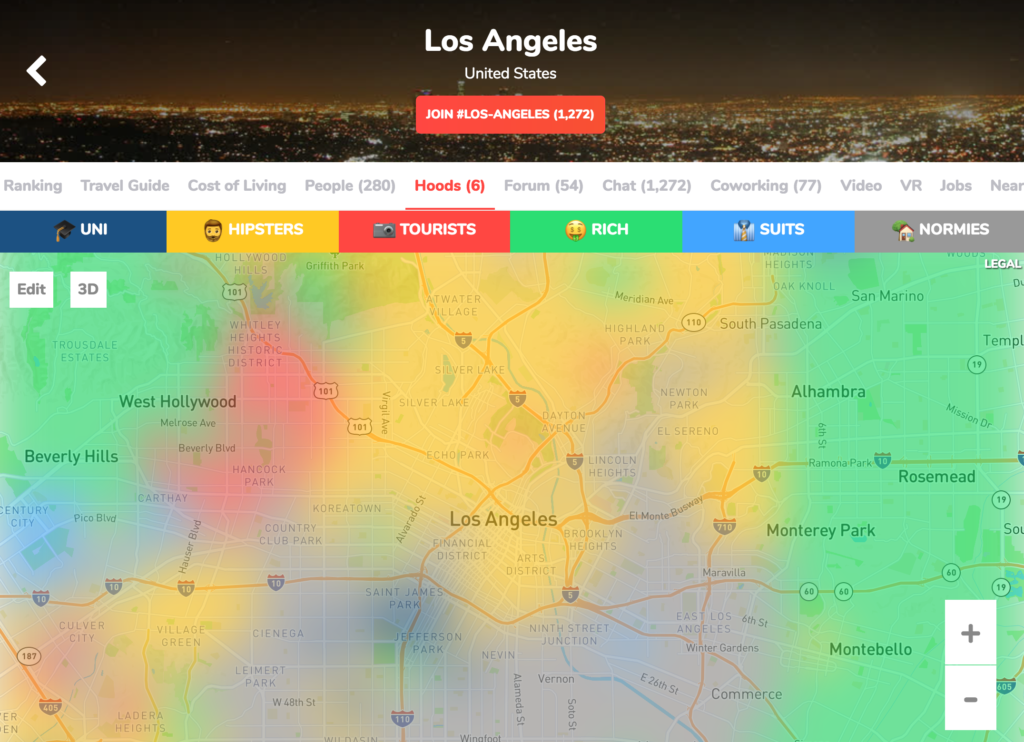
…to a working app:
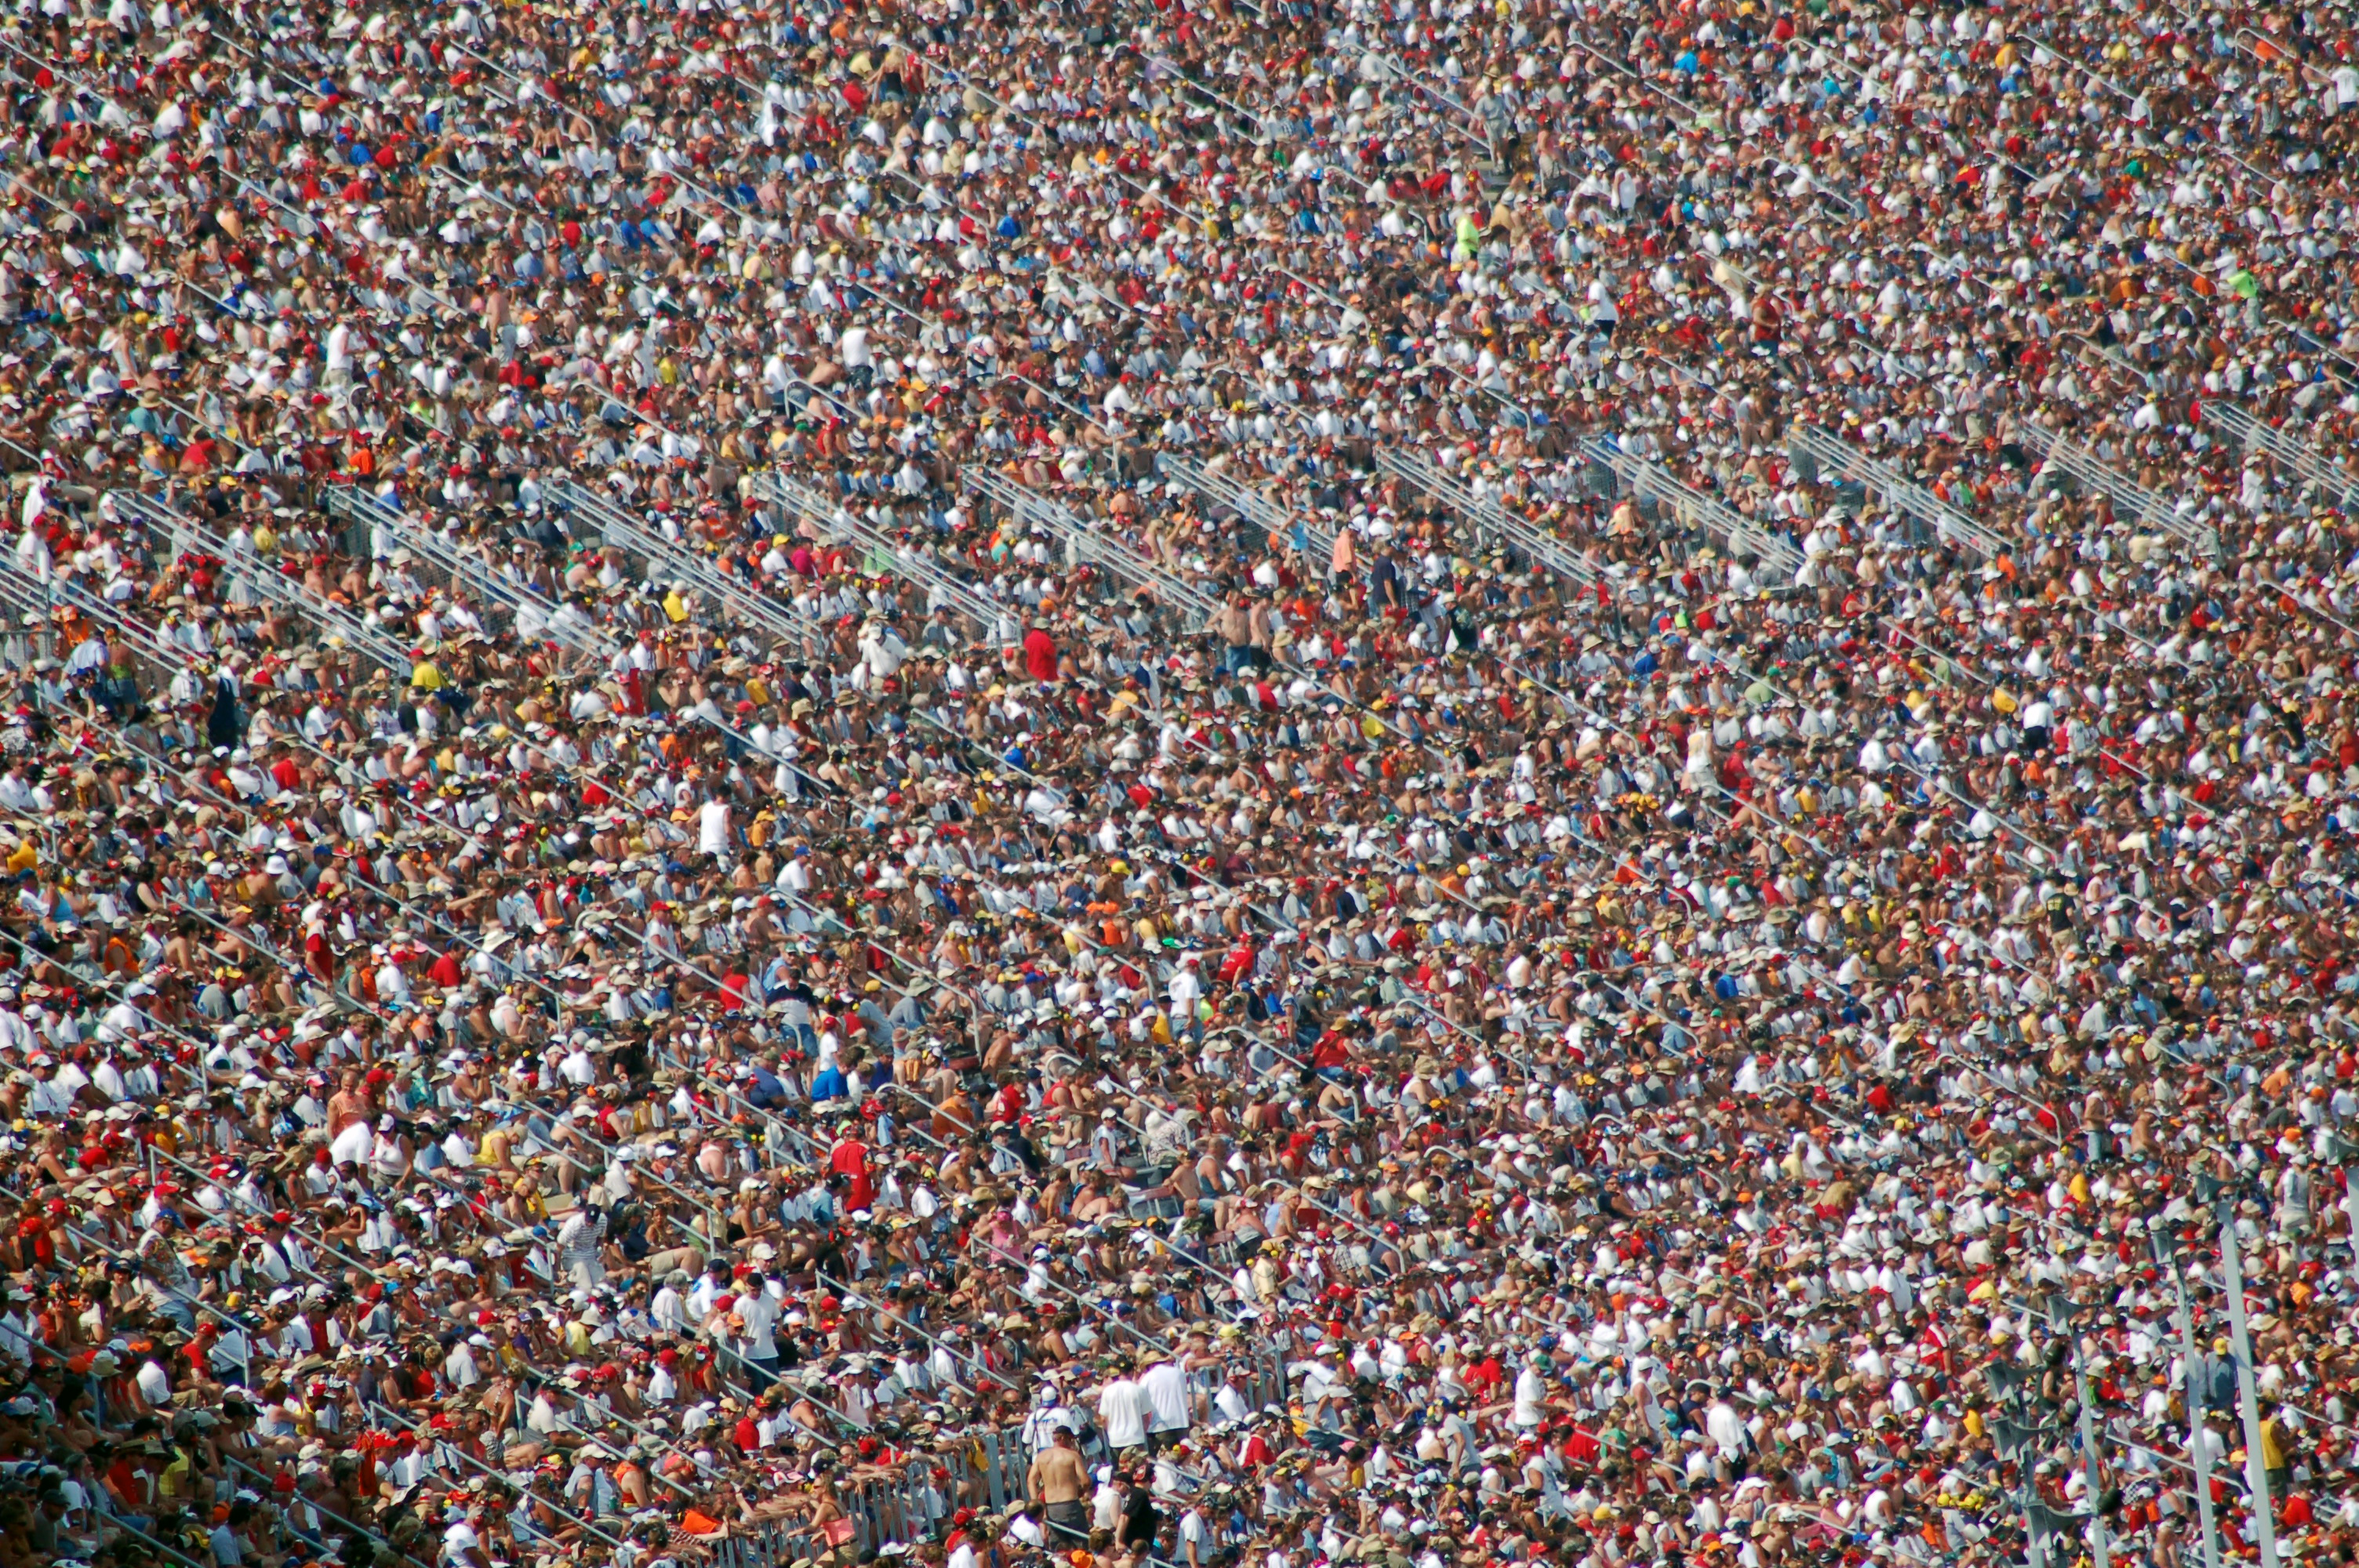
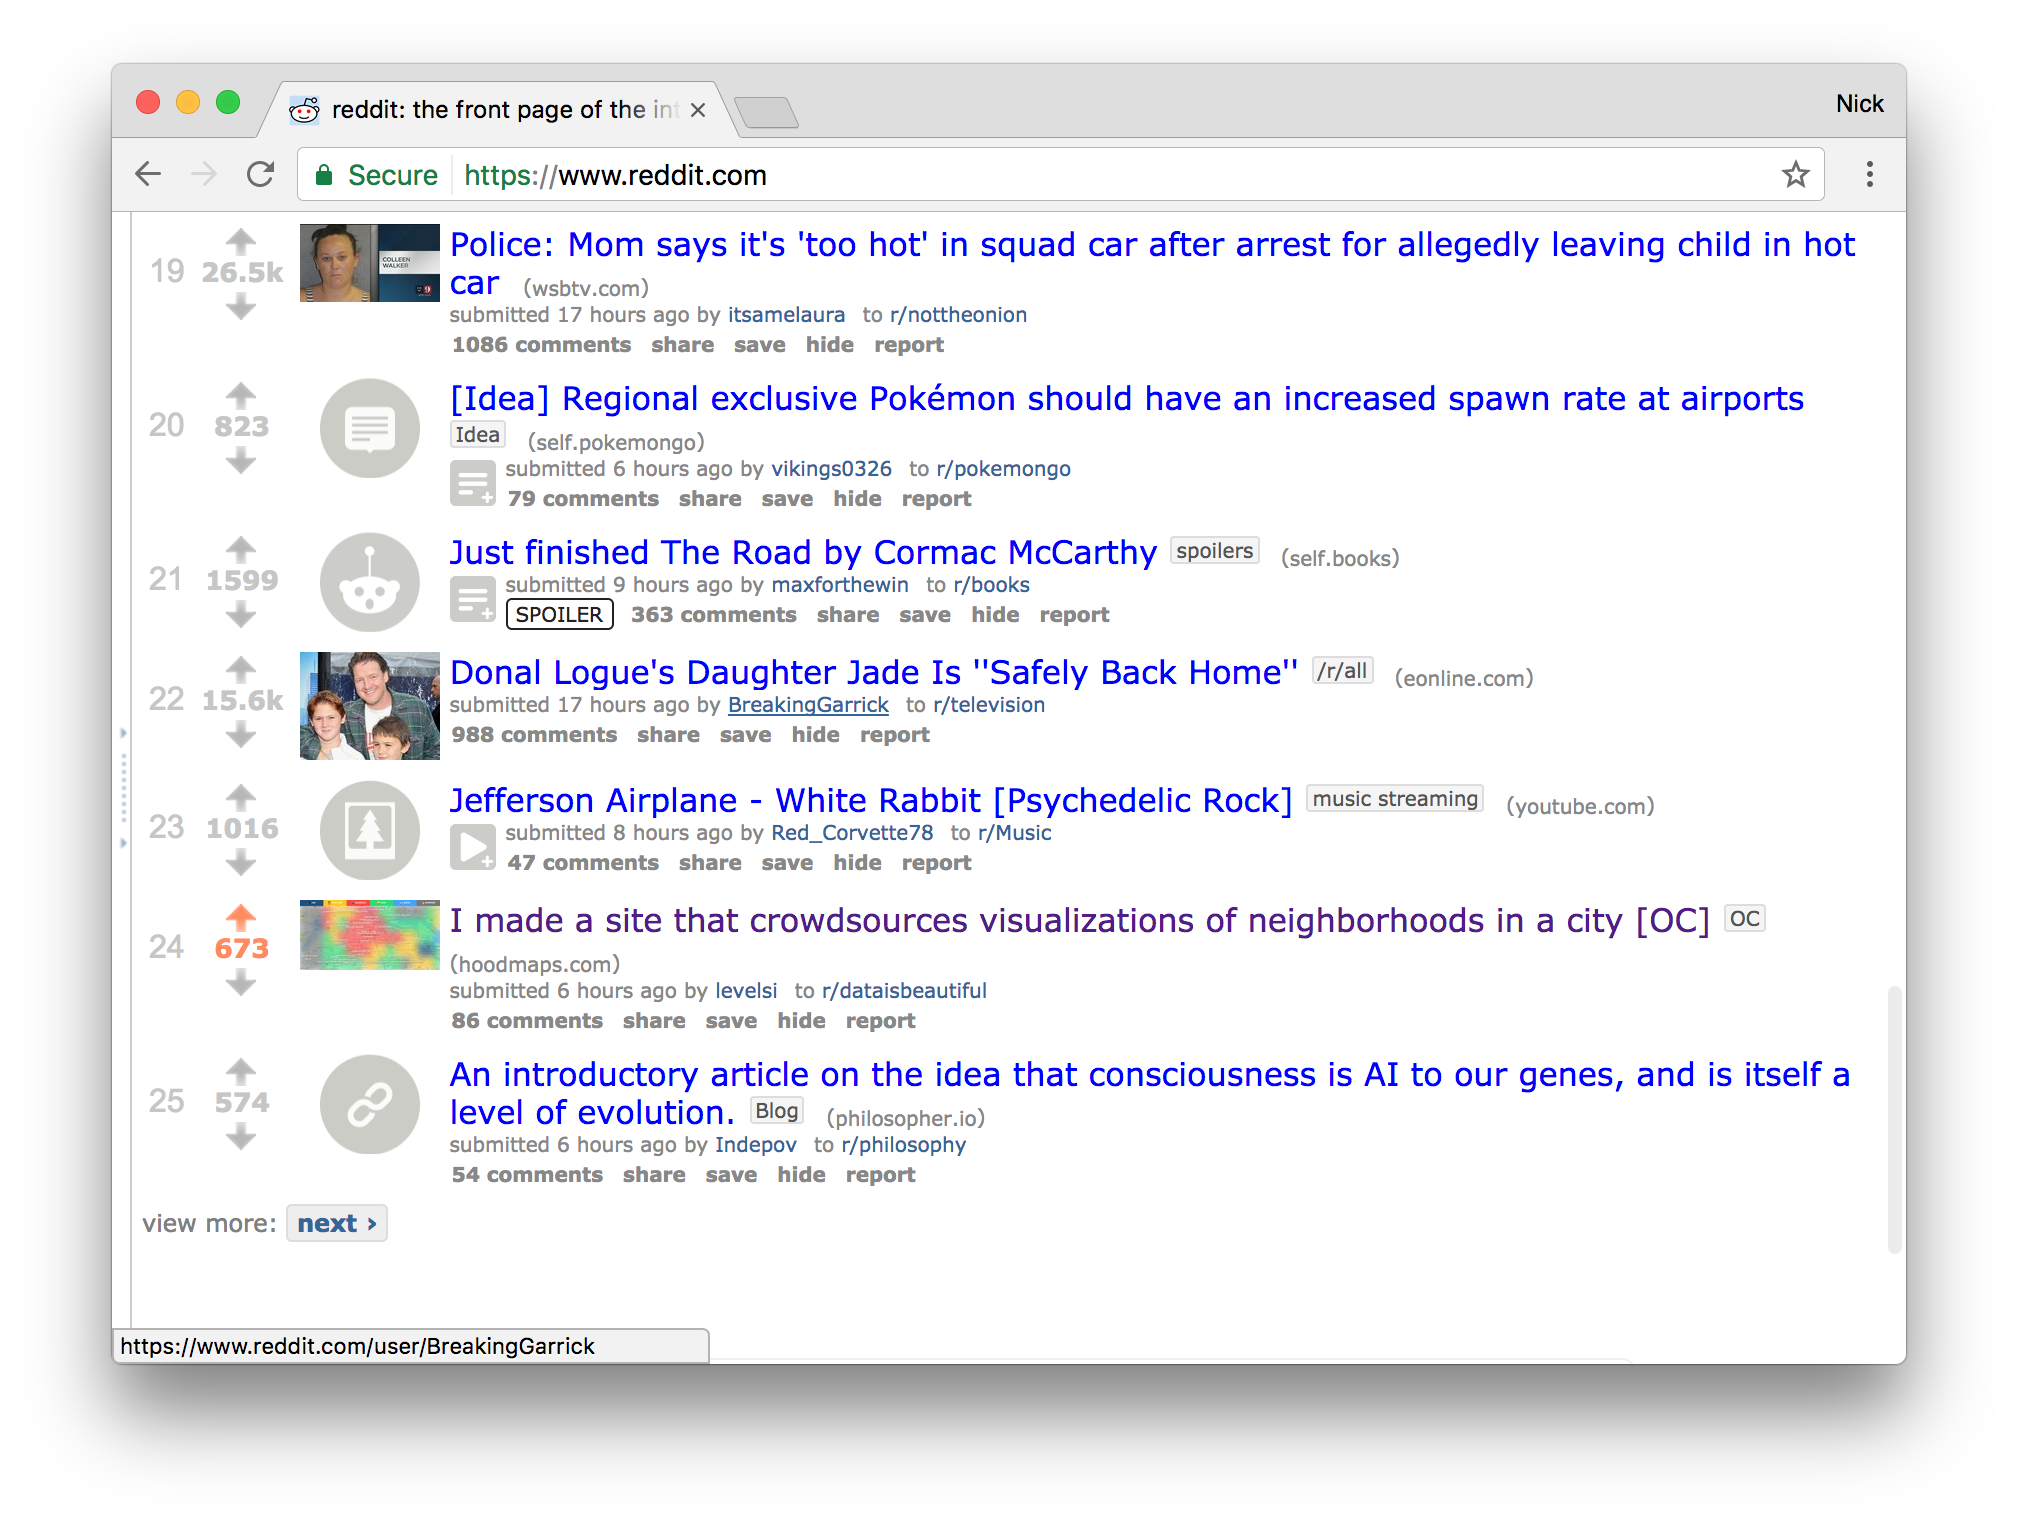
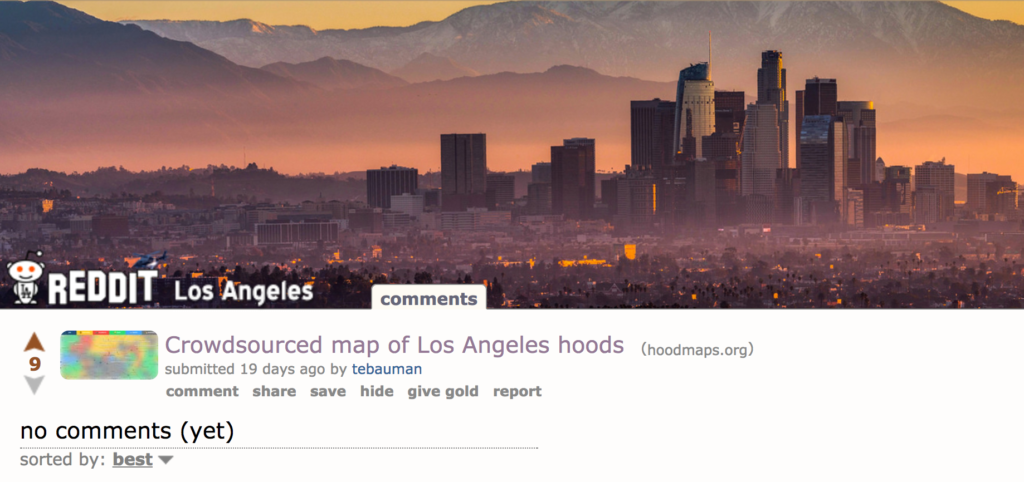
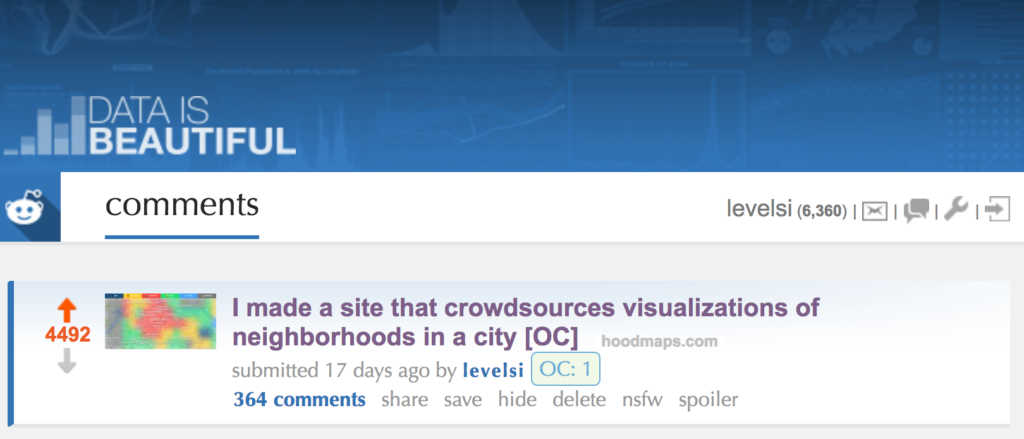
…to the front page of Reddit:
Process
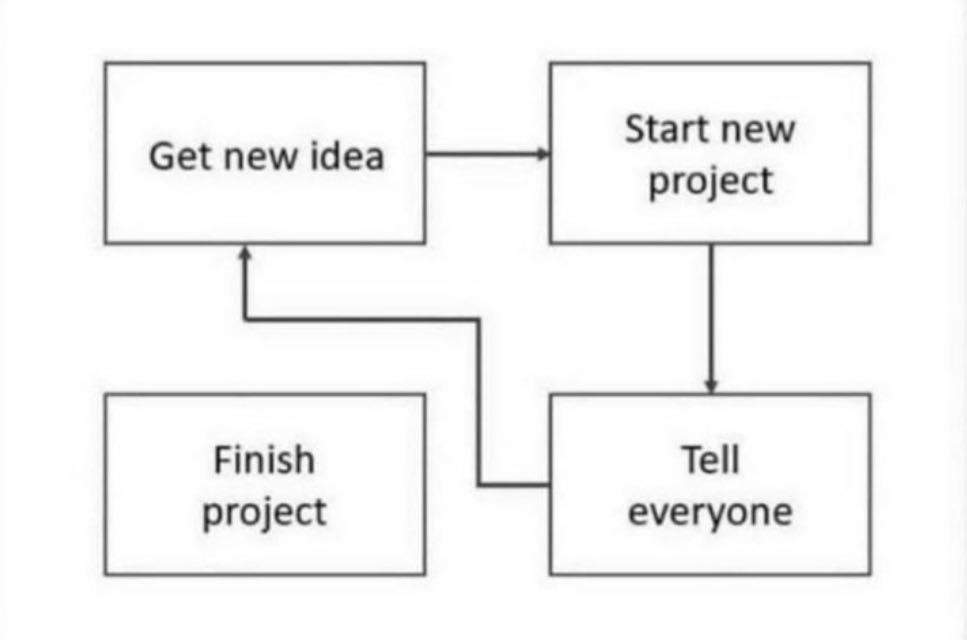
I’ve always wanted to record the entire process from building a small side project that then turned into a successful launch and then potentially into an actual business. When you hear about a successful startup in the news, they’re probably already a few years in and you have no idea how it got started.
You might think “well, I could never do that”, but you forget that Uber, or Airbnb, or Google also started as tiny little apps one day. The first version of anything always sucks. It should. But then with iteration it becomes something. And in case of startups, that tiny little dysfunctional app might become a $120,000/year bootstrapped business. Or get acquired for a few million dollars by a big company. Or grow by itself to become a billion dollar IPO’ing company. Or nothing. You don’t knows what something can be come until you ship!
So let’s backtrack. Because for the first time ever, I have every single moment logged until launch.
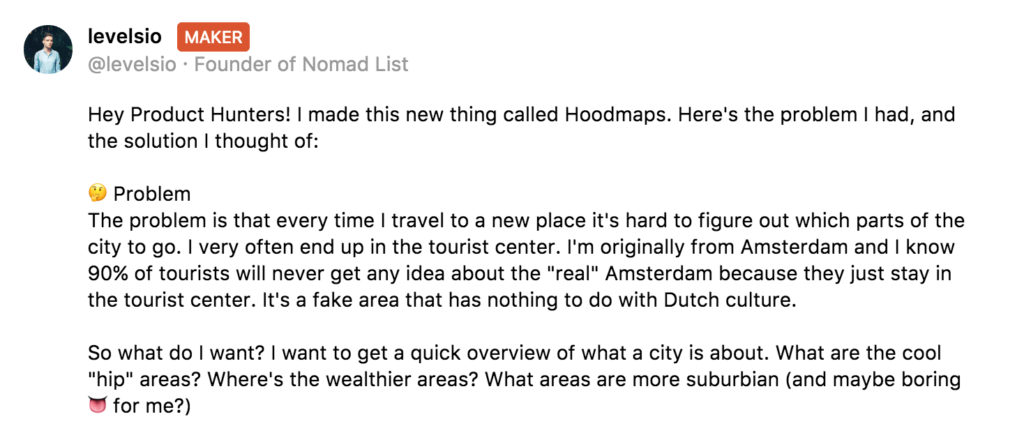
Problem
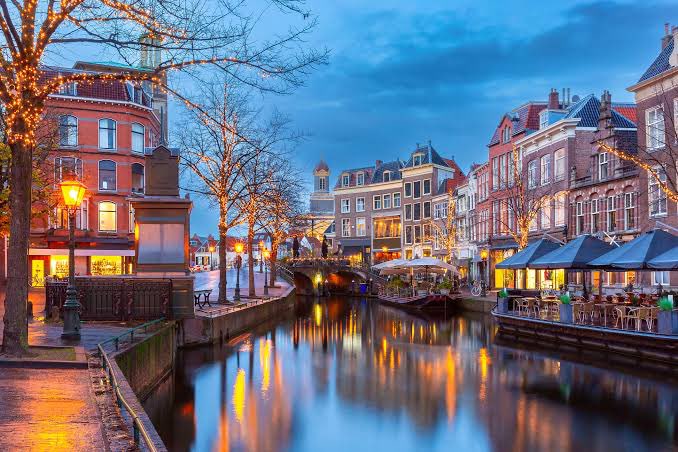
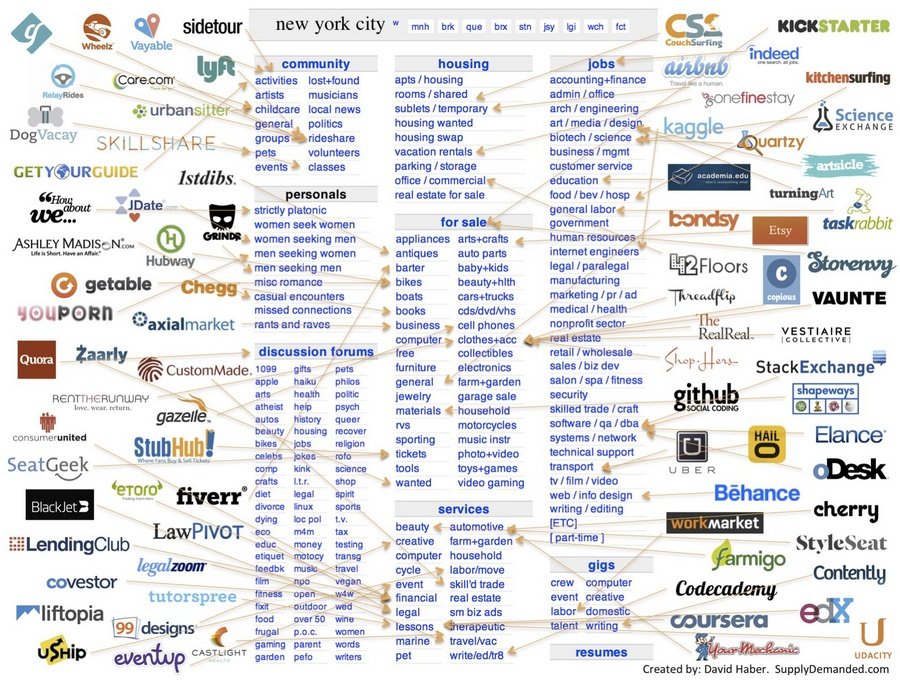
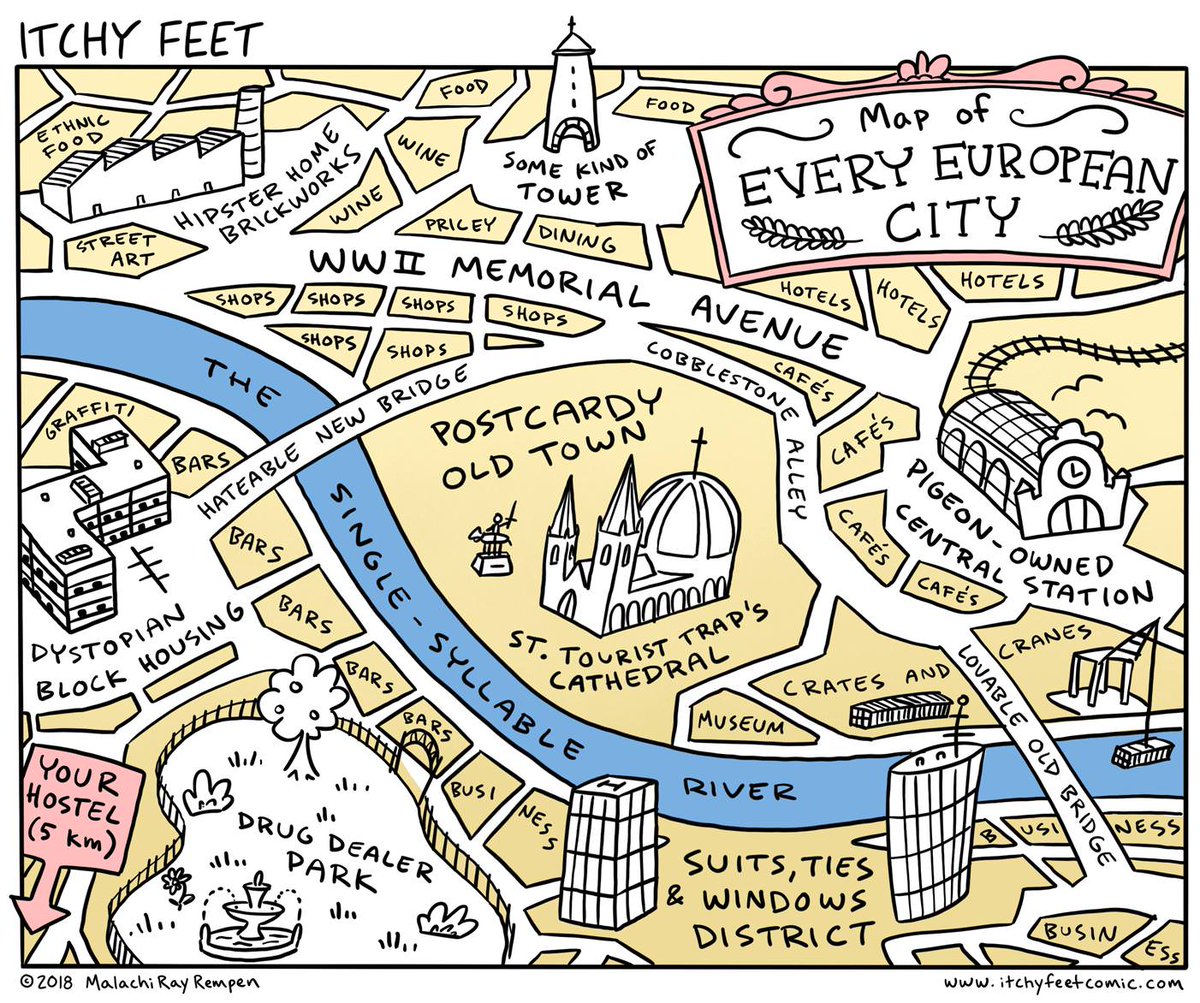
The problem is that every time I travel to a new place it’s hard to figure out which parts of the city to go. I very often end up in the tourist center. I’m originally from Amsterdam and I know 90% of tourists will never get any idea about the “real” Amsterdam because they just stay in the tourist center. It’s a fake area that has nothing to do with Dutch culture.
So what do I want? I want to get a quick overview of what a city is about. What are the cool “hip” areas? Where’s the wealthier areas? What areas are more suburbian (and maybe boring for me?).
Solution
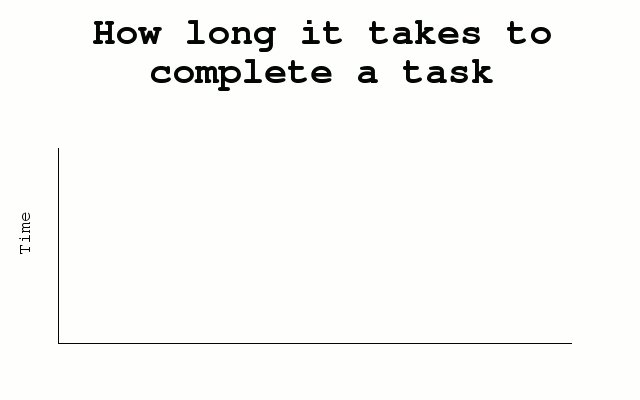
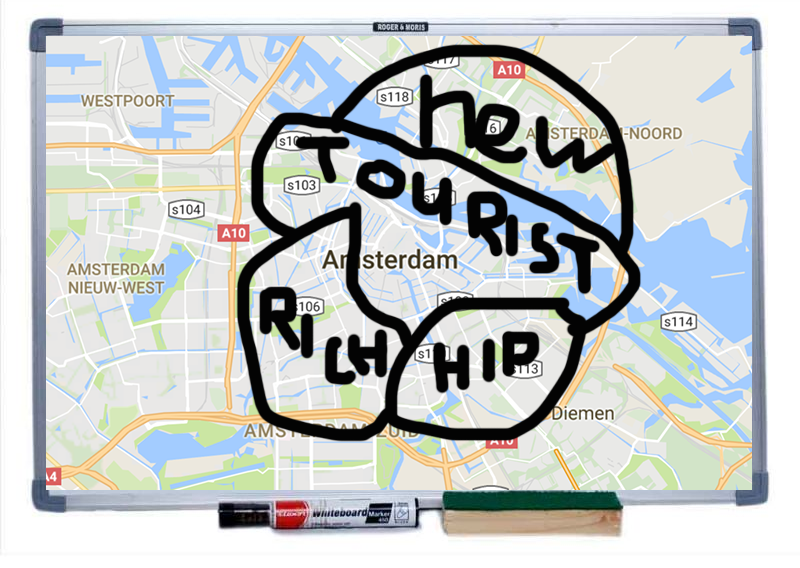
This problem has been going for years. When my friend Amy was visiting Amsterdam in 2015, she asked me where to stay. I drew her this map. This was basic but it gave the idea of at least to avoid the tourist areas:
I made a map for @genericdreams of Amsterdam, just a few parts of Amsterdam that are actually still authentic + fun pic.twitter.com/aZ6Zaw2ZVH
— Pieter Levels @ 🇺🇸 (@levelsio) September 4, 2015
But what if I could build this in a web app where I could draw over a map myself with different colors representing different categories. Every color people draw would represent a different category. I’d have hipster, tourist, wealthy, suburb, business and student area colors. What if I could average everybody’s drawings and show that? Like crowdsourced, would that work? So if 5 people draw over an area that it’s tourist, but 8 draw over it that it’s hipster, it’ll show up as hipster?
Let’s try.
Building
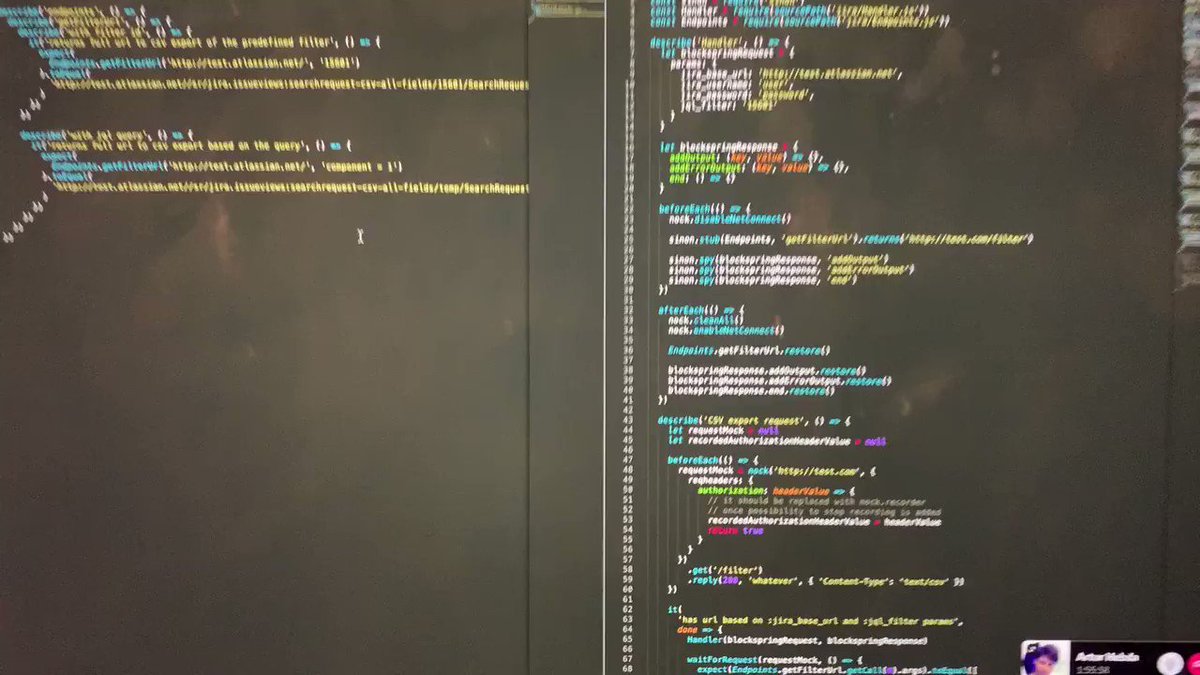
I decided to livestream my build process on Twitch. I was going to code it from the start while streaming.
Day 1 (2017-03-31)
📺 I'm live streaming on @twitch coding a new thing called Hood Maps from zero 👉 t.co/VNpJMQTuId pic.twitter.com/UpUKlFor2A
— Pieter Levels @ 🇺🇸 (@levelsio) March 31, 2017
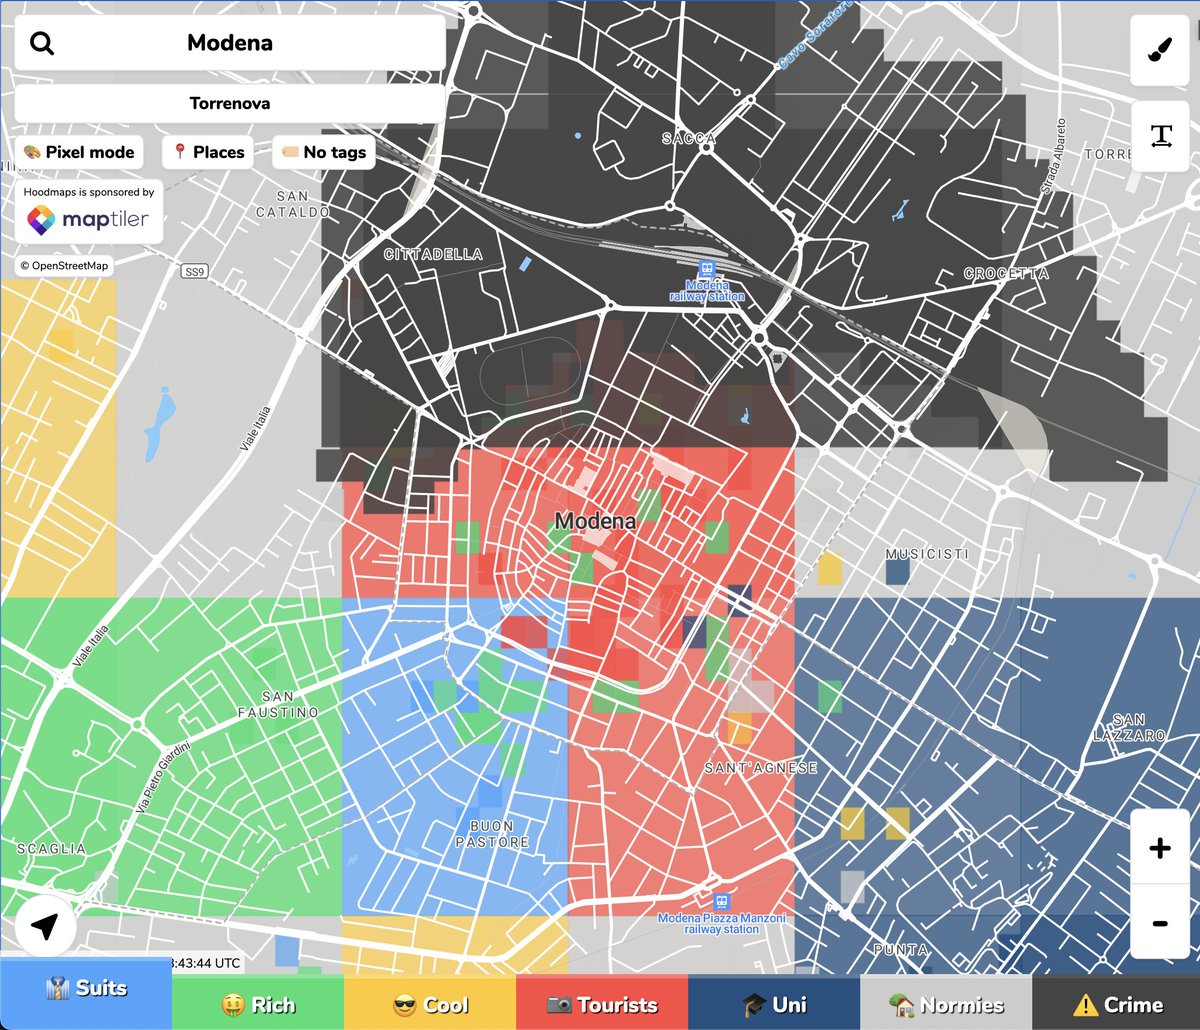
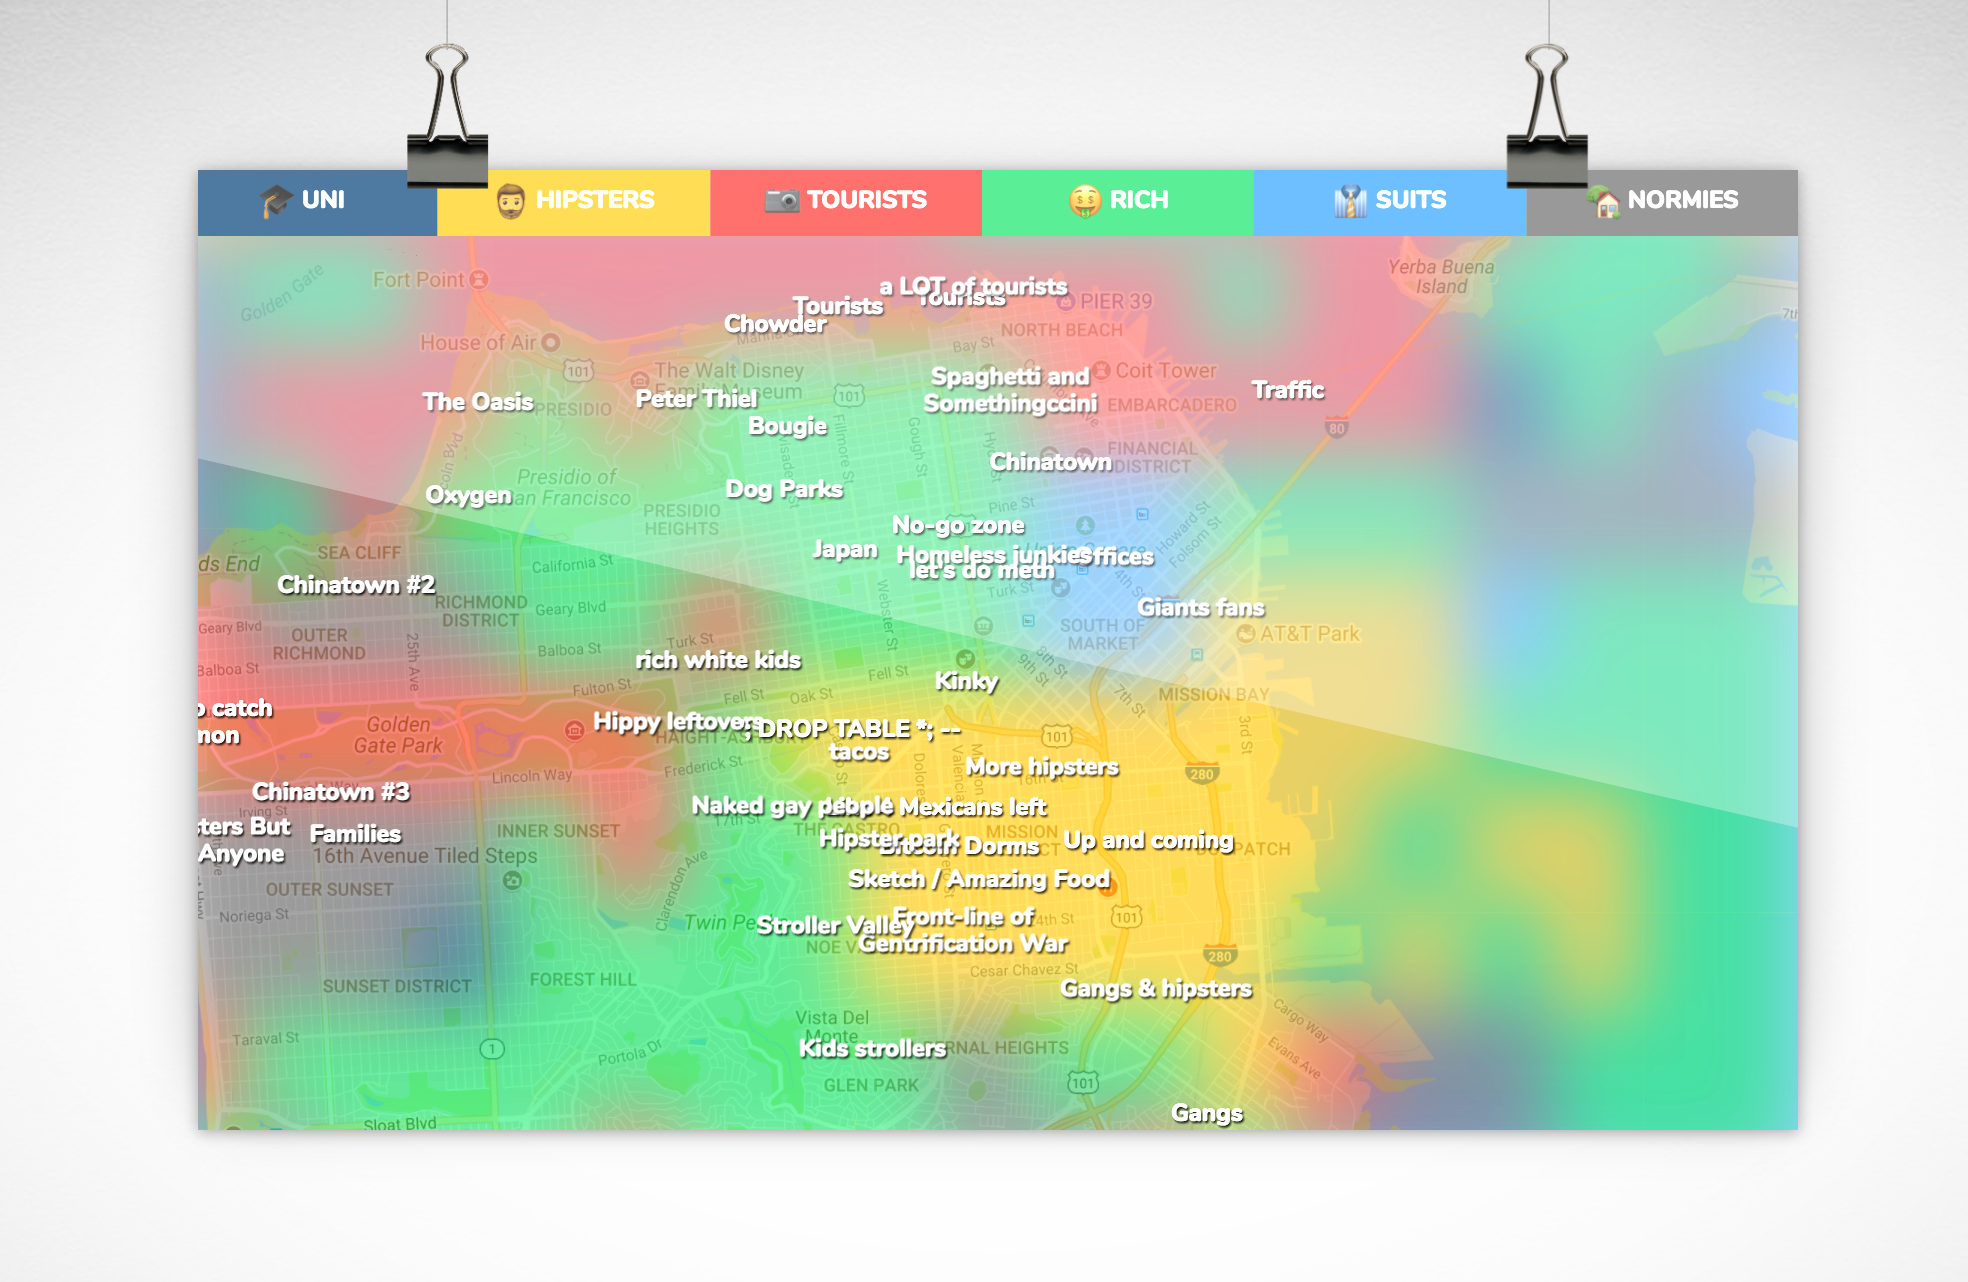
On day 1, I’ll build the first prototype of Hoodmaps. My idea was to make a map anyone can draw on and categorize a city by colors which in turn reference to certain categories like “hipster” or “business”. This way, you can navigate a city better.
I start out with just plain HTML, CSS and JS and we see how far we get. At the end we have a functioning map that you can draw on with colors. We also put the page live in production (on Nomad List’s server but still):
First version of hoodmaps.io built on @twitch live in ⏰ 2 hours and 31 minutes 🌊 t.co/6AFA4Q96id Use it: t.co/oblHoQCmgu pic.twitter.com/p8oTT8xt0N
— Pieter Levels @ 🇺🇸 (@levelsio) March 31, 2017
Day 1 music: Rinse FM Podcast – Swamp 81 w/ Loefah – 30th March 2017
Day 2 (2017-04-01)
(if video is blocked, use a VPN to USA, it’s cause of the music)
On day 2, we’re going to improve the colors, and send our drawing data to the server, so it’s saved and can be viewed by other users. On Day 2 and we got our first public drawings in:
✨ Day 2 of Building 🗺Hood Maps 🌊 live streamed 🔥 we have a proof of concept 📝 people drew this 😍 Watch the replay: t.co/Q2fmCtGQg3 pic.twitter.com/UHW8YuVyqI
— Pieter Levels @ 🇺🇸 (@levelsio) April 1, 2017
Day 2 music: Rinse FM Podcast – Norwood Soul Patrol – 26th March 2017
Day 3 (2017-04-02)
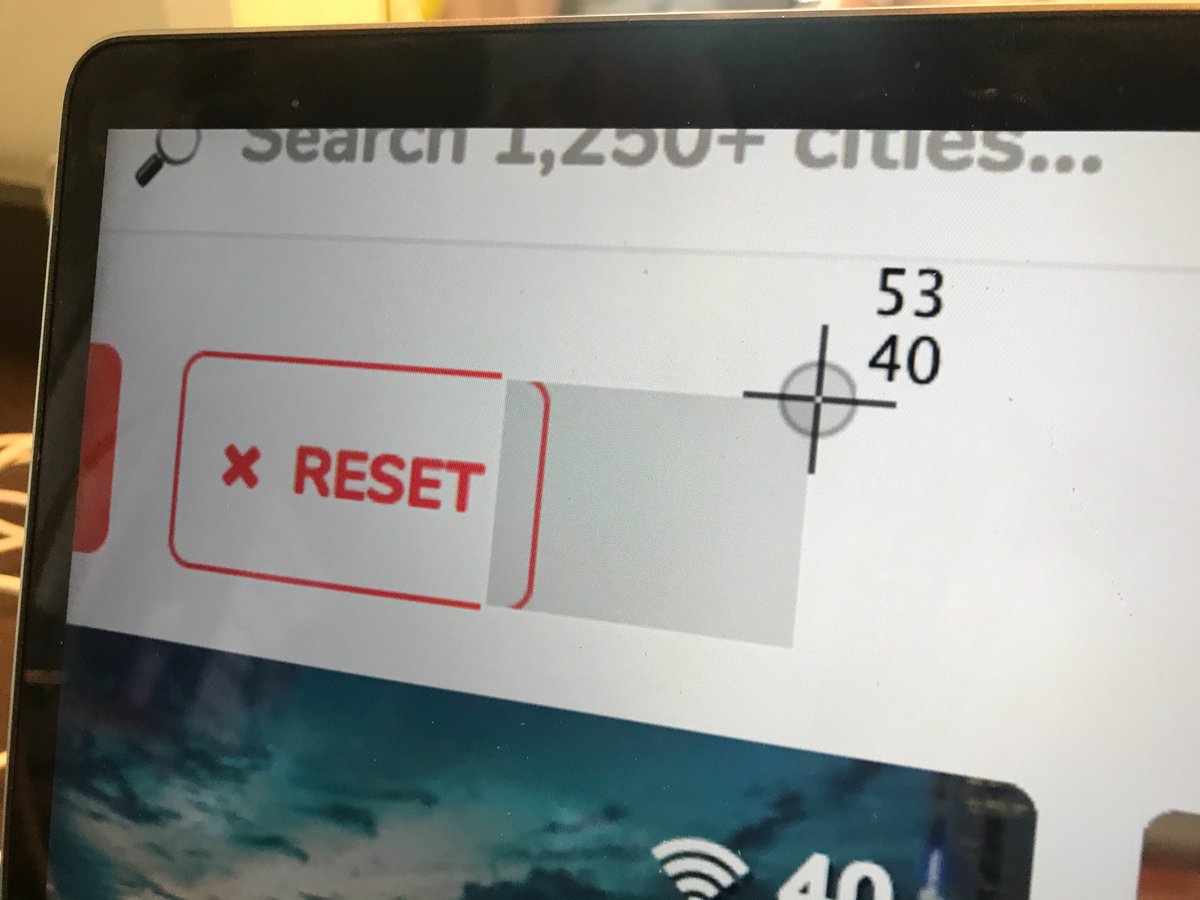
On day 3, I add normalization of the data. This means that we don’t want to have every specific GPS coordinate drawn, instead we want to have brush strokes referencing a bigger “area” (like 100 by 100 meters), instead of a specific GPS spot (1 by 1 meter). We do this by changing a GPS coordinate like (53.23437348, -4.2338447) to (53.234, -4.233) and (53.23, -4.233) and (53.2, -4.2) etc. Every decimal we removes, we get less specific data. By normalizing the specific data, we summarize the colors in an area, and only show the dominant value. So if most people say this neighborhood is tourist, we’ll show that. More on normalization later.
..and Part 2:
From here it starts getting difficult because we’re dealing with math and brush sizes and pure hell. This is where you regret starting a project. But we fight through!
Also I optimized the mobile version of the site:
Yay! 📲 Mobile version of 🗺Hood Maps works, streaming live still t.co/VNpJMQTuId pic.twitter.com/KmaEFp0VBM
— Pieter Levels @ 🇺🇸 (@levelsio) April 2, 2017
Day 3 music pt 1: Rinse FM Podcast – Redlight – 27th March 2017
Day 3 music pt 2: Rinse FM Podcast – Silencer – 1st April 2017
Day 4 (2014-04-04)
On day 4 we added a domain name (hoodmaps.io), NGINX configuration for the web server, SSL certificates from LetsEncrypt, we do more data normalization. It’s a slow day with lots of small final details to make the site live for users:
🏞 Live stream on @Twitch now We're going to – Add a domain – Add SSL to 🗺Hoodmapst.co/VNpJMQTuId pic.twitter.com/9N800Pr3ru
— Pieter Levels @ 🇺🇸 (@levelsio) April 3, 2017
This was the final video episode because we now had a working app. From here on, I discuss the details and incremental updates in this blog post.
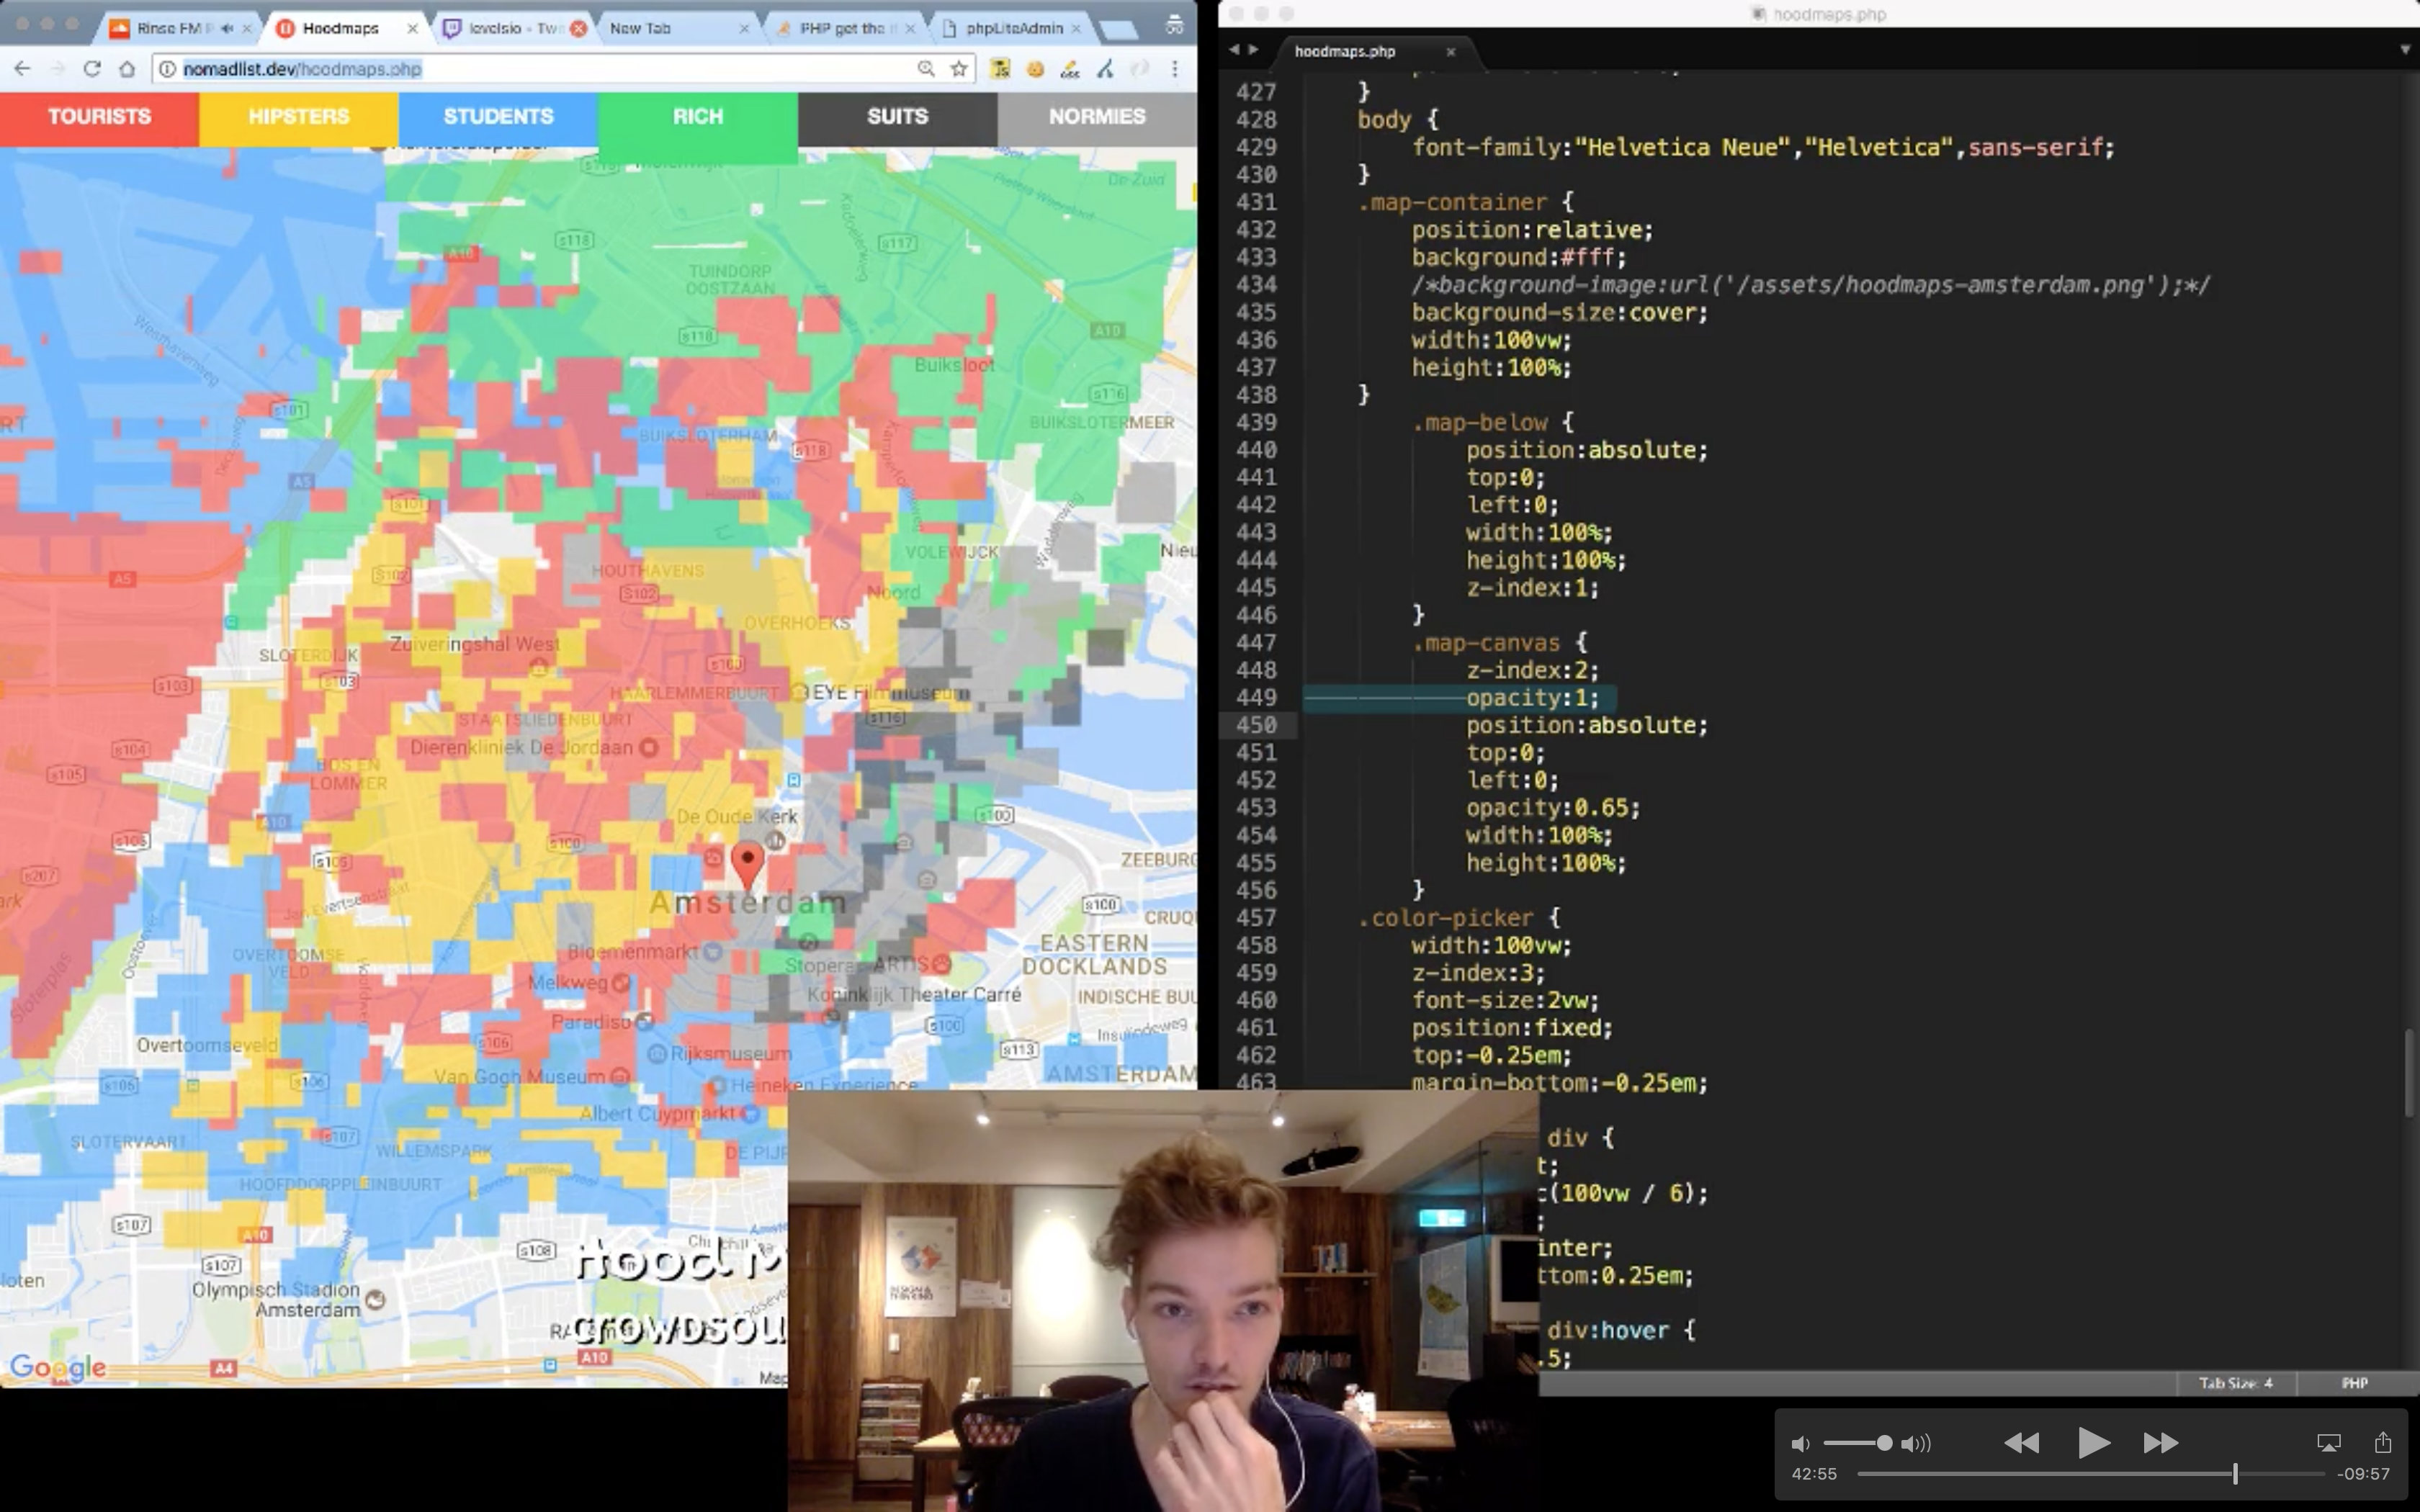
Canvas
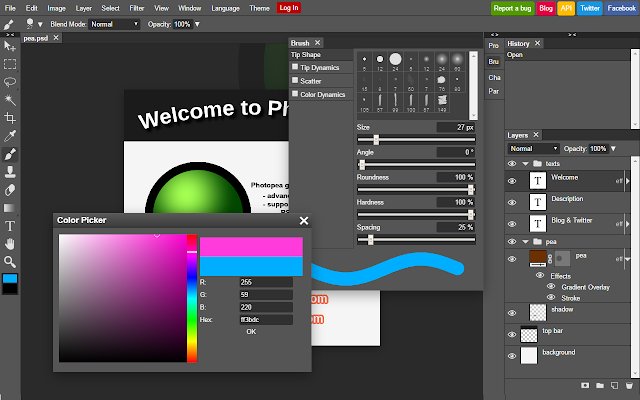
As seen in the video, I started with just a basic canvas. Canvas is a cool relatively new HTML tag that lets you make a square white box that you can draw in with JavaScript. You can literally do anything you can think off in Photoshop in HTML now with Canvas tags and some JS code. I never used it before, so I was a bit scared. But I tried:
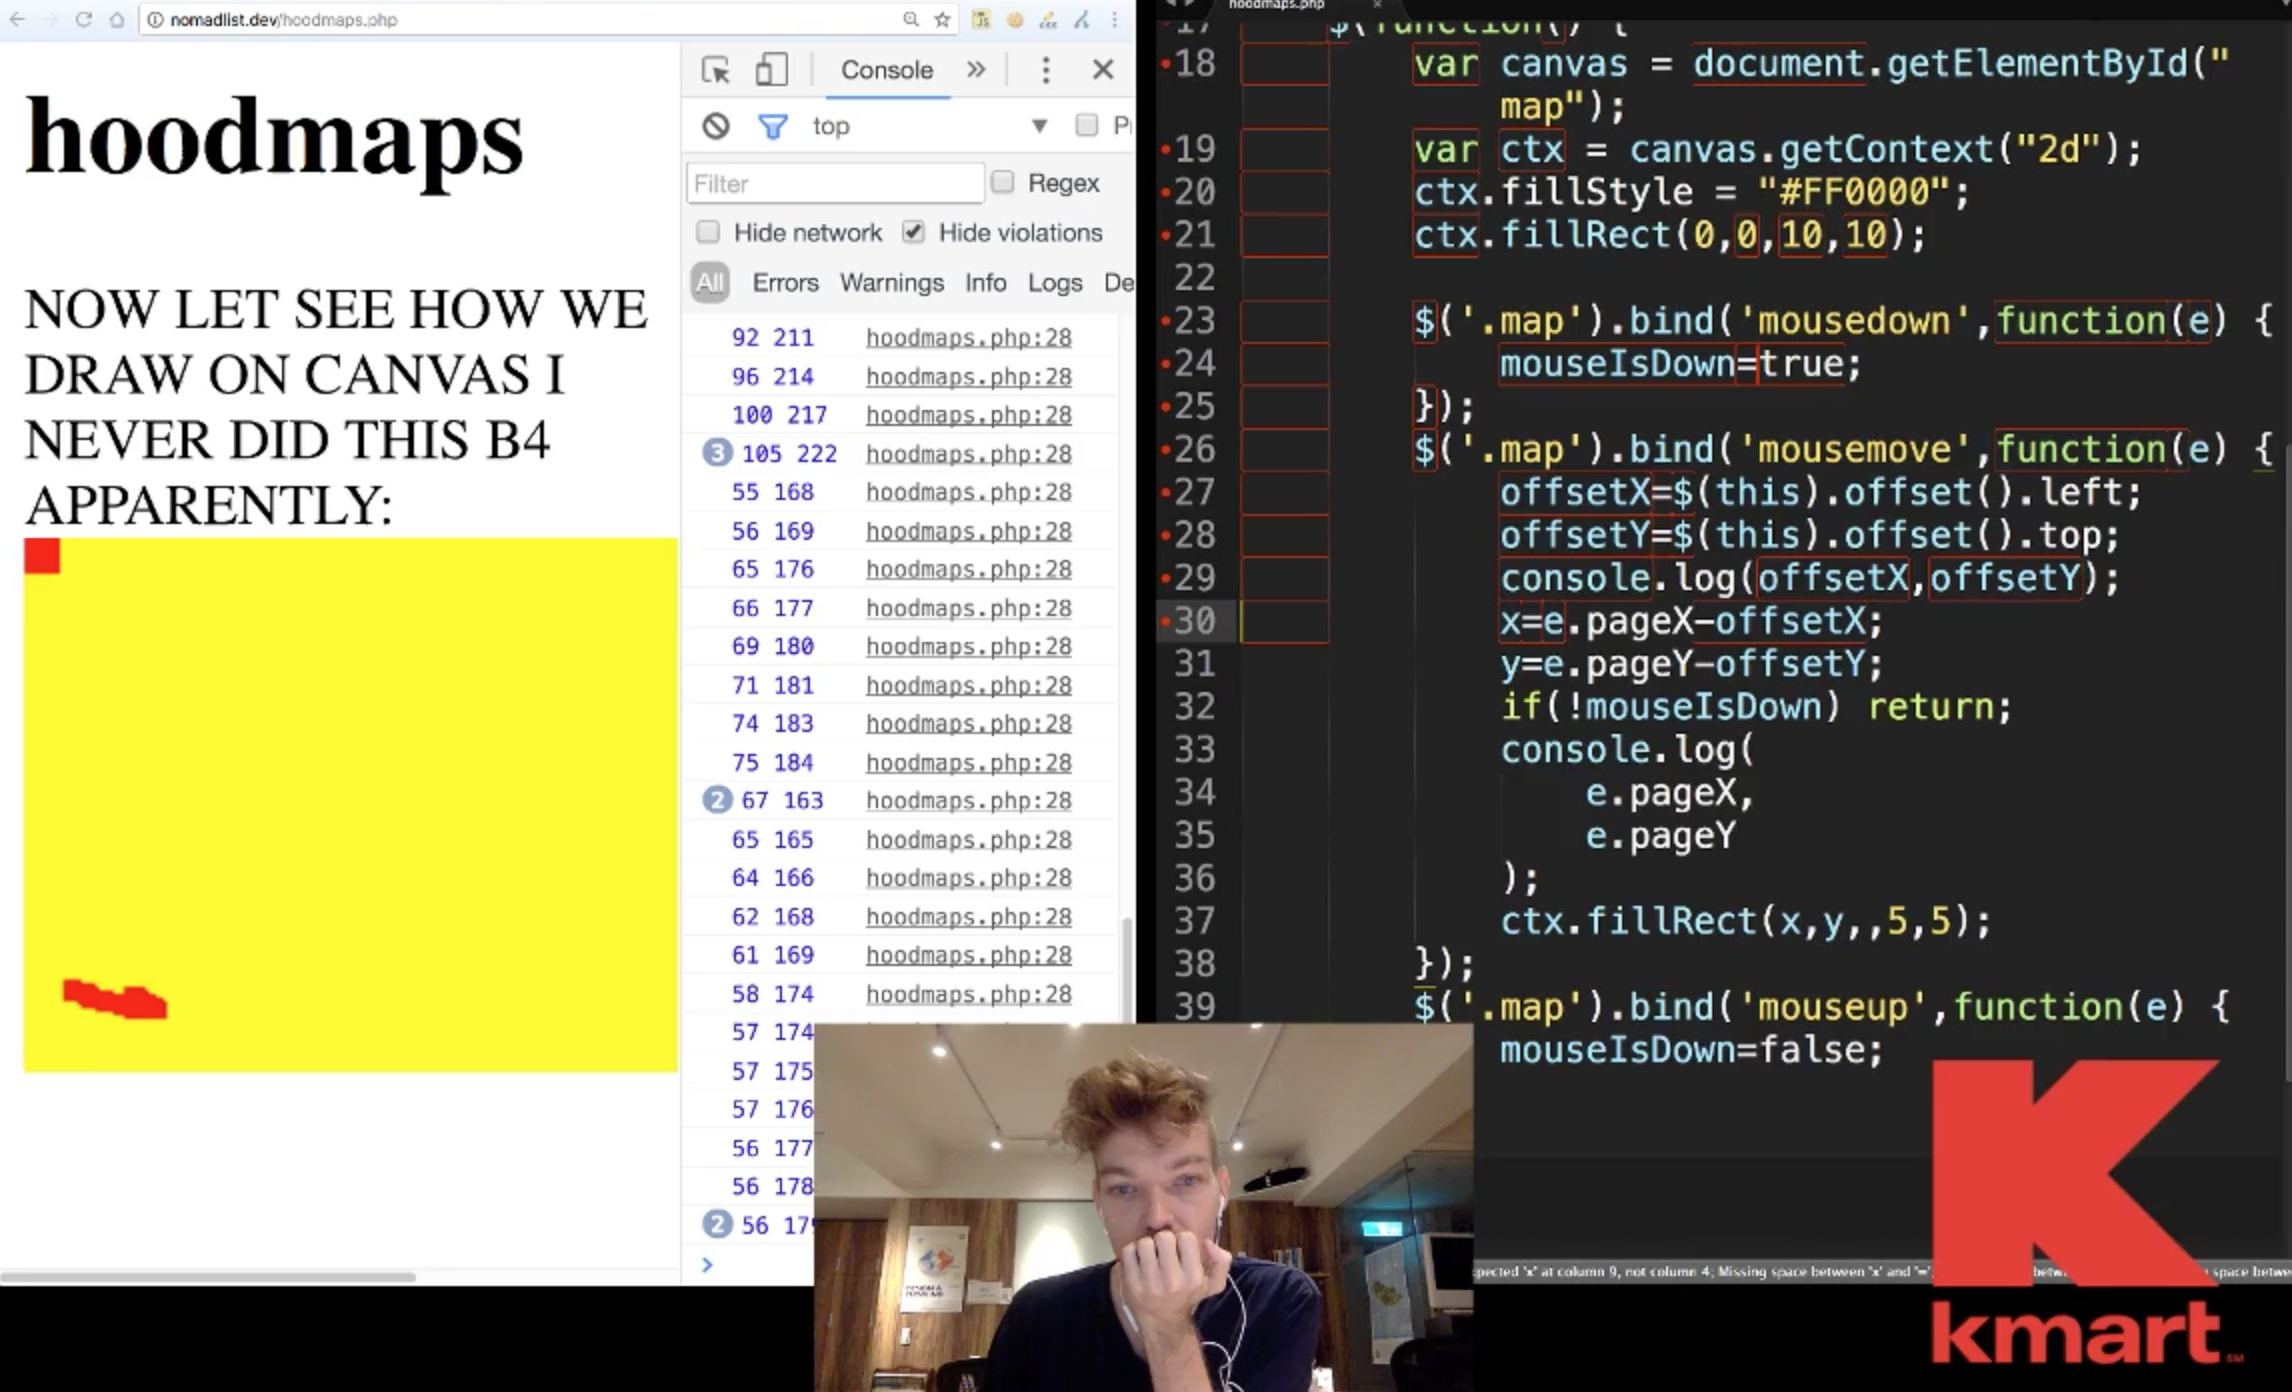
It’s as basic as figuring out how to track the mouse cursor’s coordinates (x, y) in JavaScript when you press the mouse button. And then every time the mouse moves you draw on it. Canvas has a simple function called “fillRect”:
canvas.filLStyle=’red’;
canvas.fillRect(x,y,width,height);
That simply draws a red square. Why a square? Well you can make a “square” as small as you want. So you can use a square as a brush. Yes you can also go draw a circle, but that didn’t make sense since my data was kinda square (e.g. one latitude by one longitude point) by nature!
Saving drawings to the server
Every drawing is saved to an array:
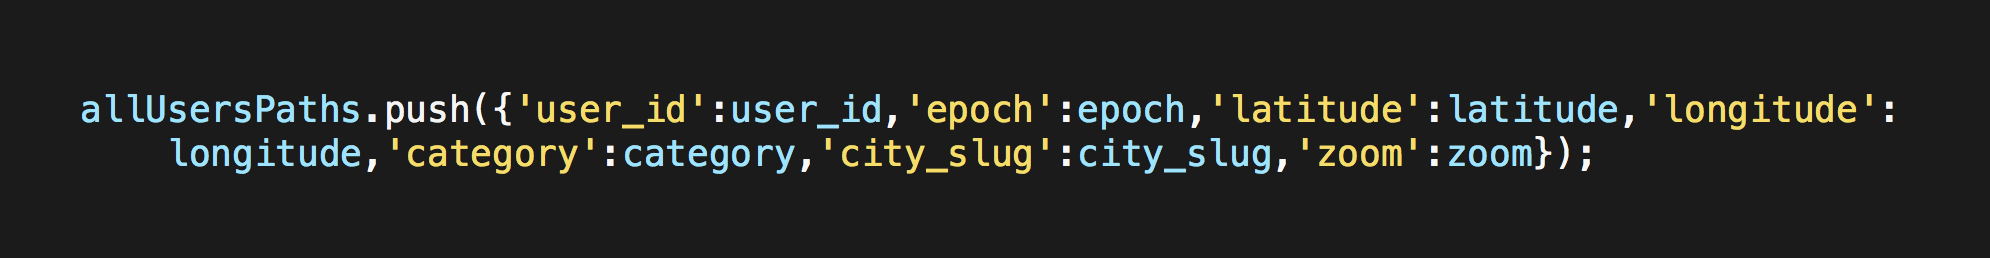
This array contains ALL coordinates, including the ones already on the page when you loaded it. I slice off the new ones and send them to the server.
I do an AJAX call to a PHP script on the server (which is simply the same script but /index.php?action=draw behind it) with the drawings. I didn’t want to overload the server, so I buffer the drawings and then do a setTimeout() timer to send them to the server every 5 seconds:
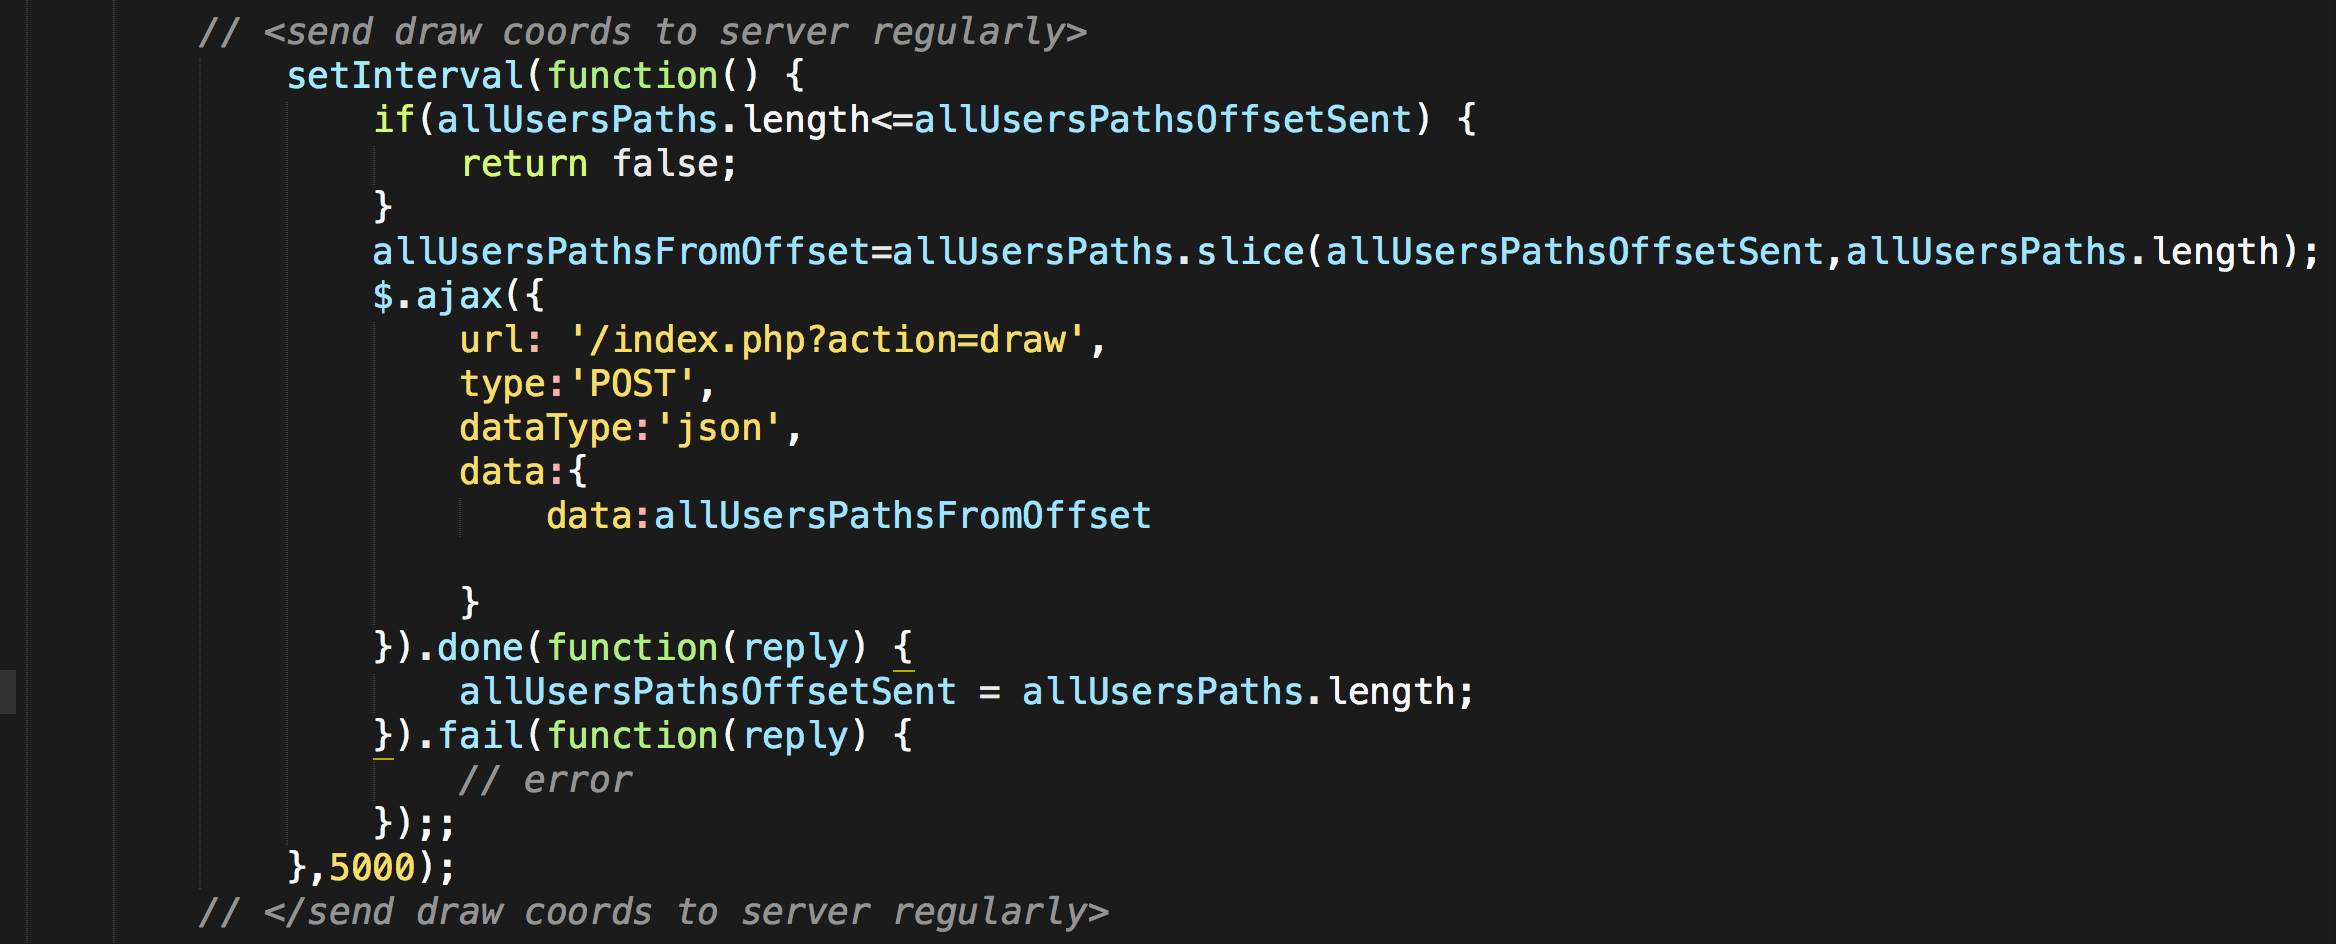
The setTimeout() is reset every time you draw, so unless you stop with drawing I won’t send. If you stop drawing, I’ll send it in 5 seconds.
⌗ Database
Skip through if this stuff isn’t interesting but I’ll now talk about how I set up the database structure to save the coordinates from JavaScript sent to the server.
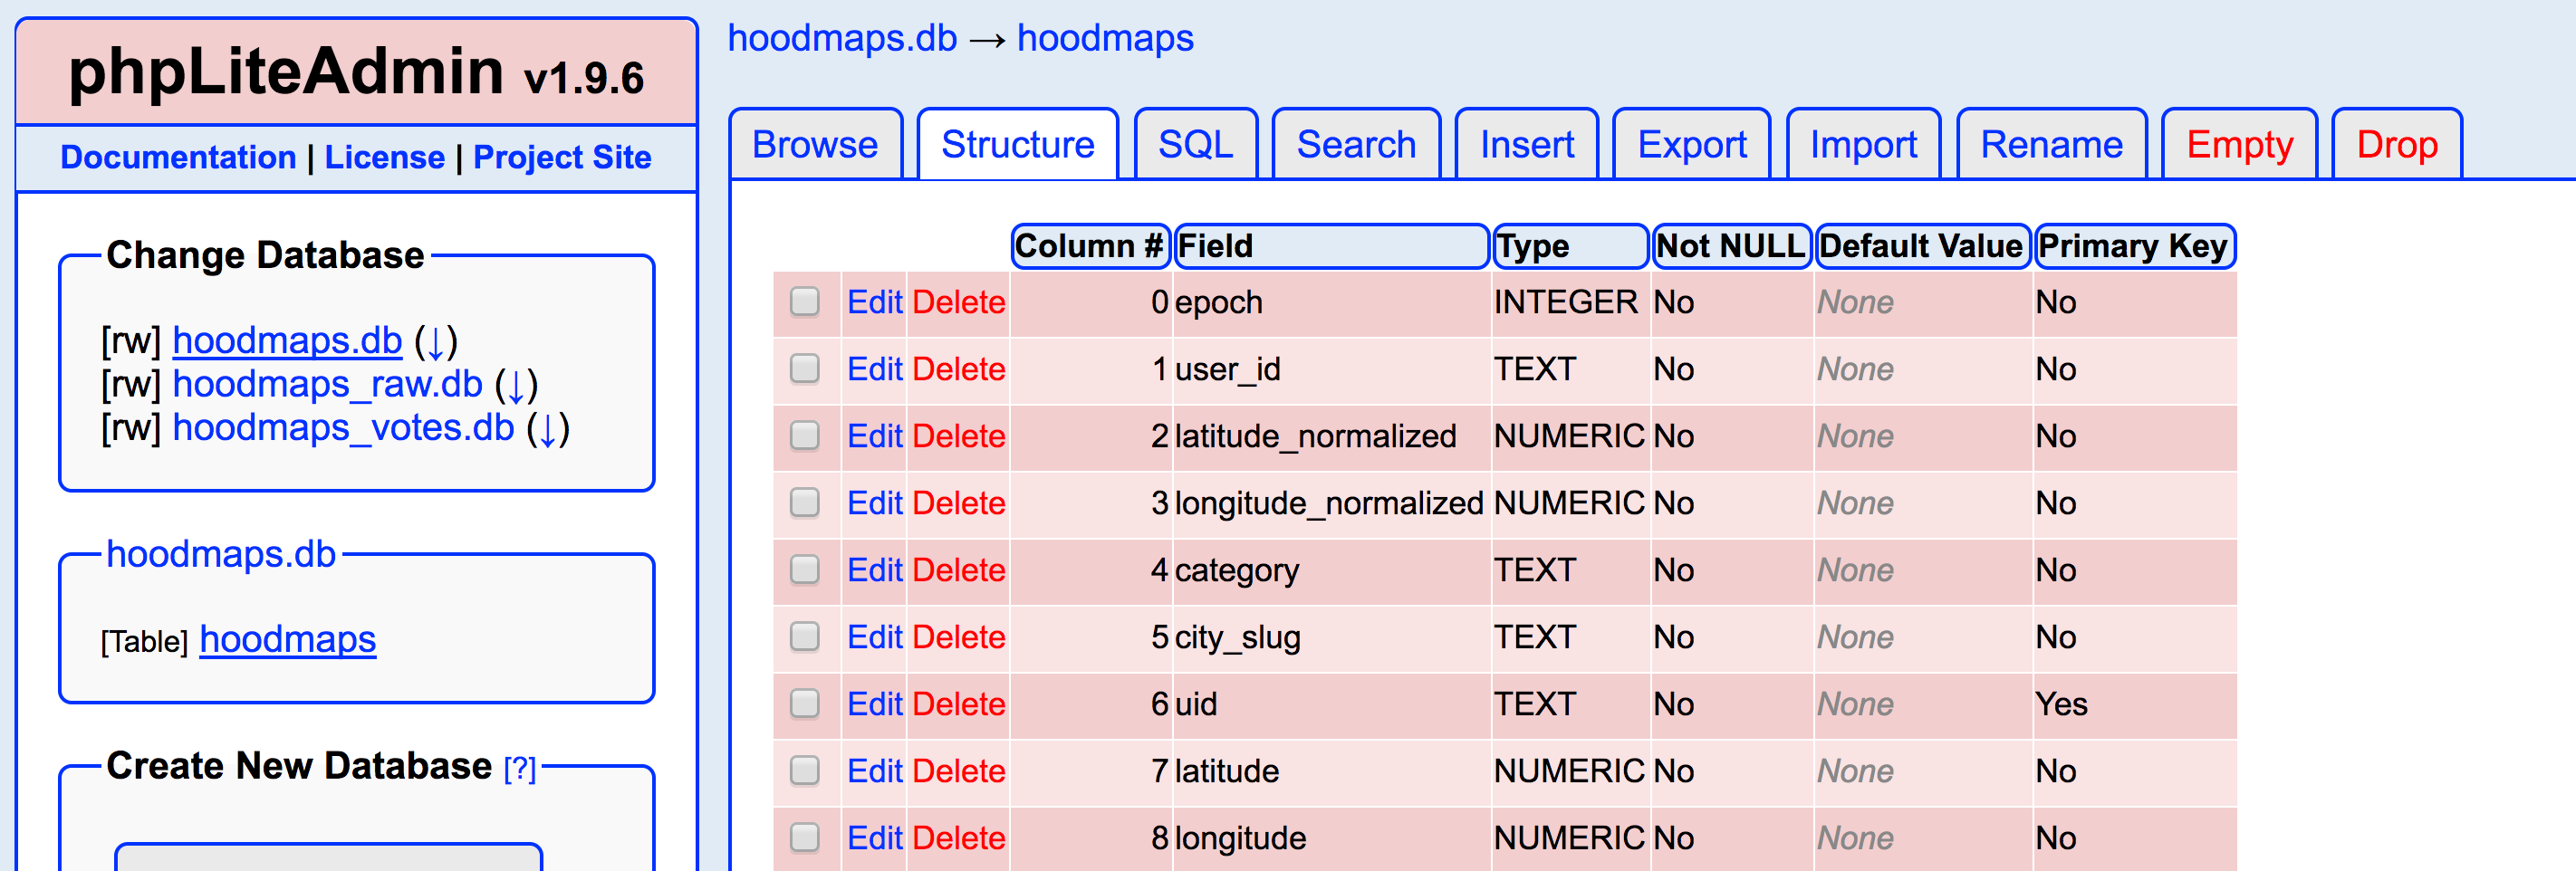
Each drawing on the map is saved to a SQLite database. I use SQLite cause it’s simple and fast, but definitely not optimal if you want to do many writes at the same time (we’ll find that out later during launch, read on).
Each coordinate on the map is read from the database and checked for entries. For example (this is pseudo-code):
[52.37029884,4.8930113243] : [‘hipsters’,’suits’,’normies’,’normies’,’normies’,’hipsters’,’uni’,’hipsters’,’uni’,’hipsters’]
With 4 entries, “hipsters” is the most dominant category on this geocoordinate. So we draw it yellow (the color of the hipster category).
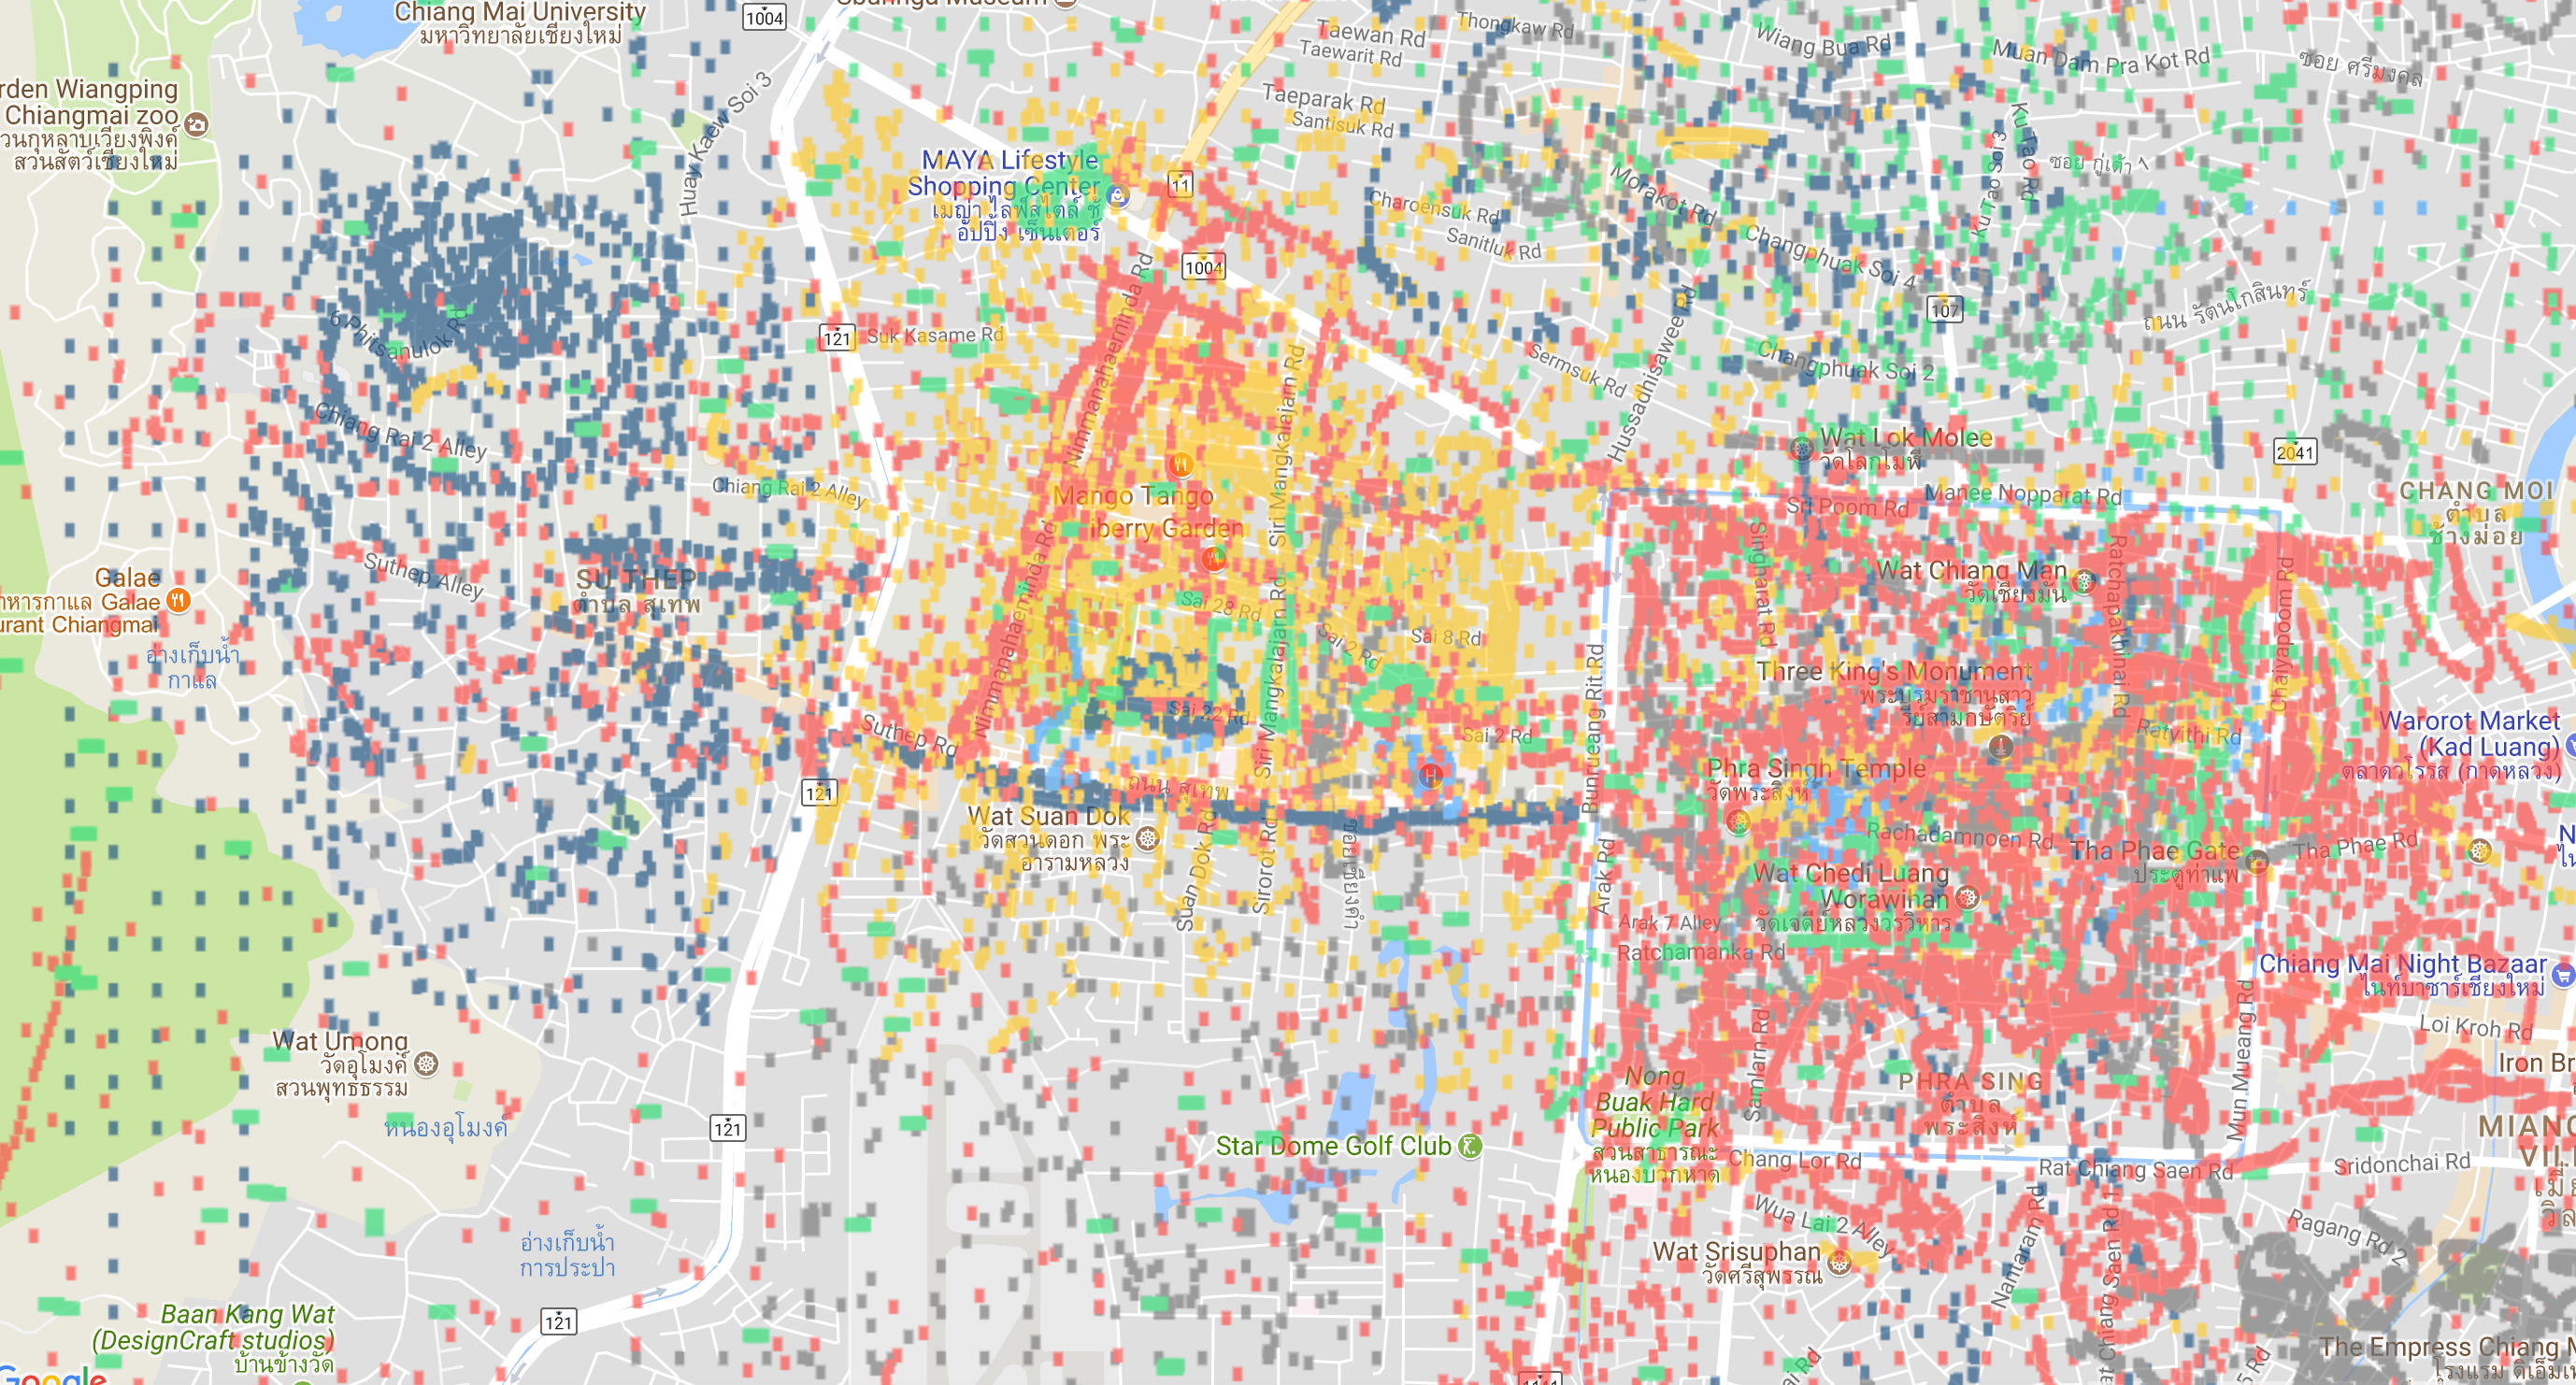
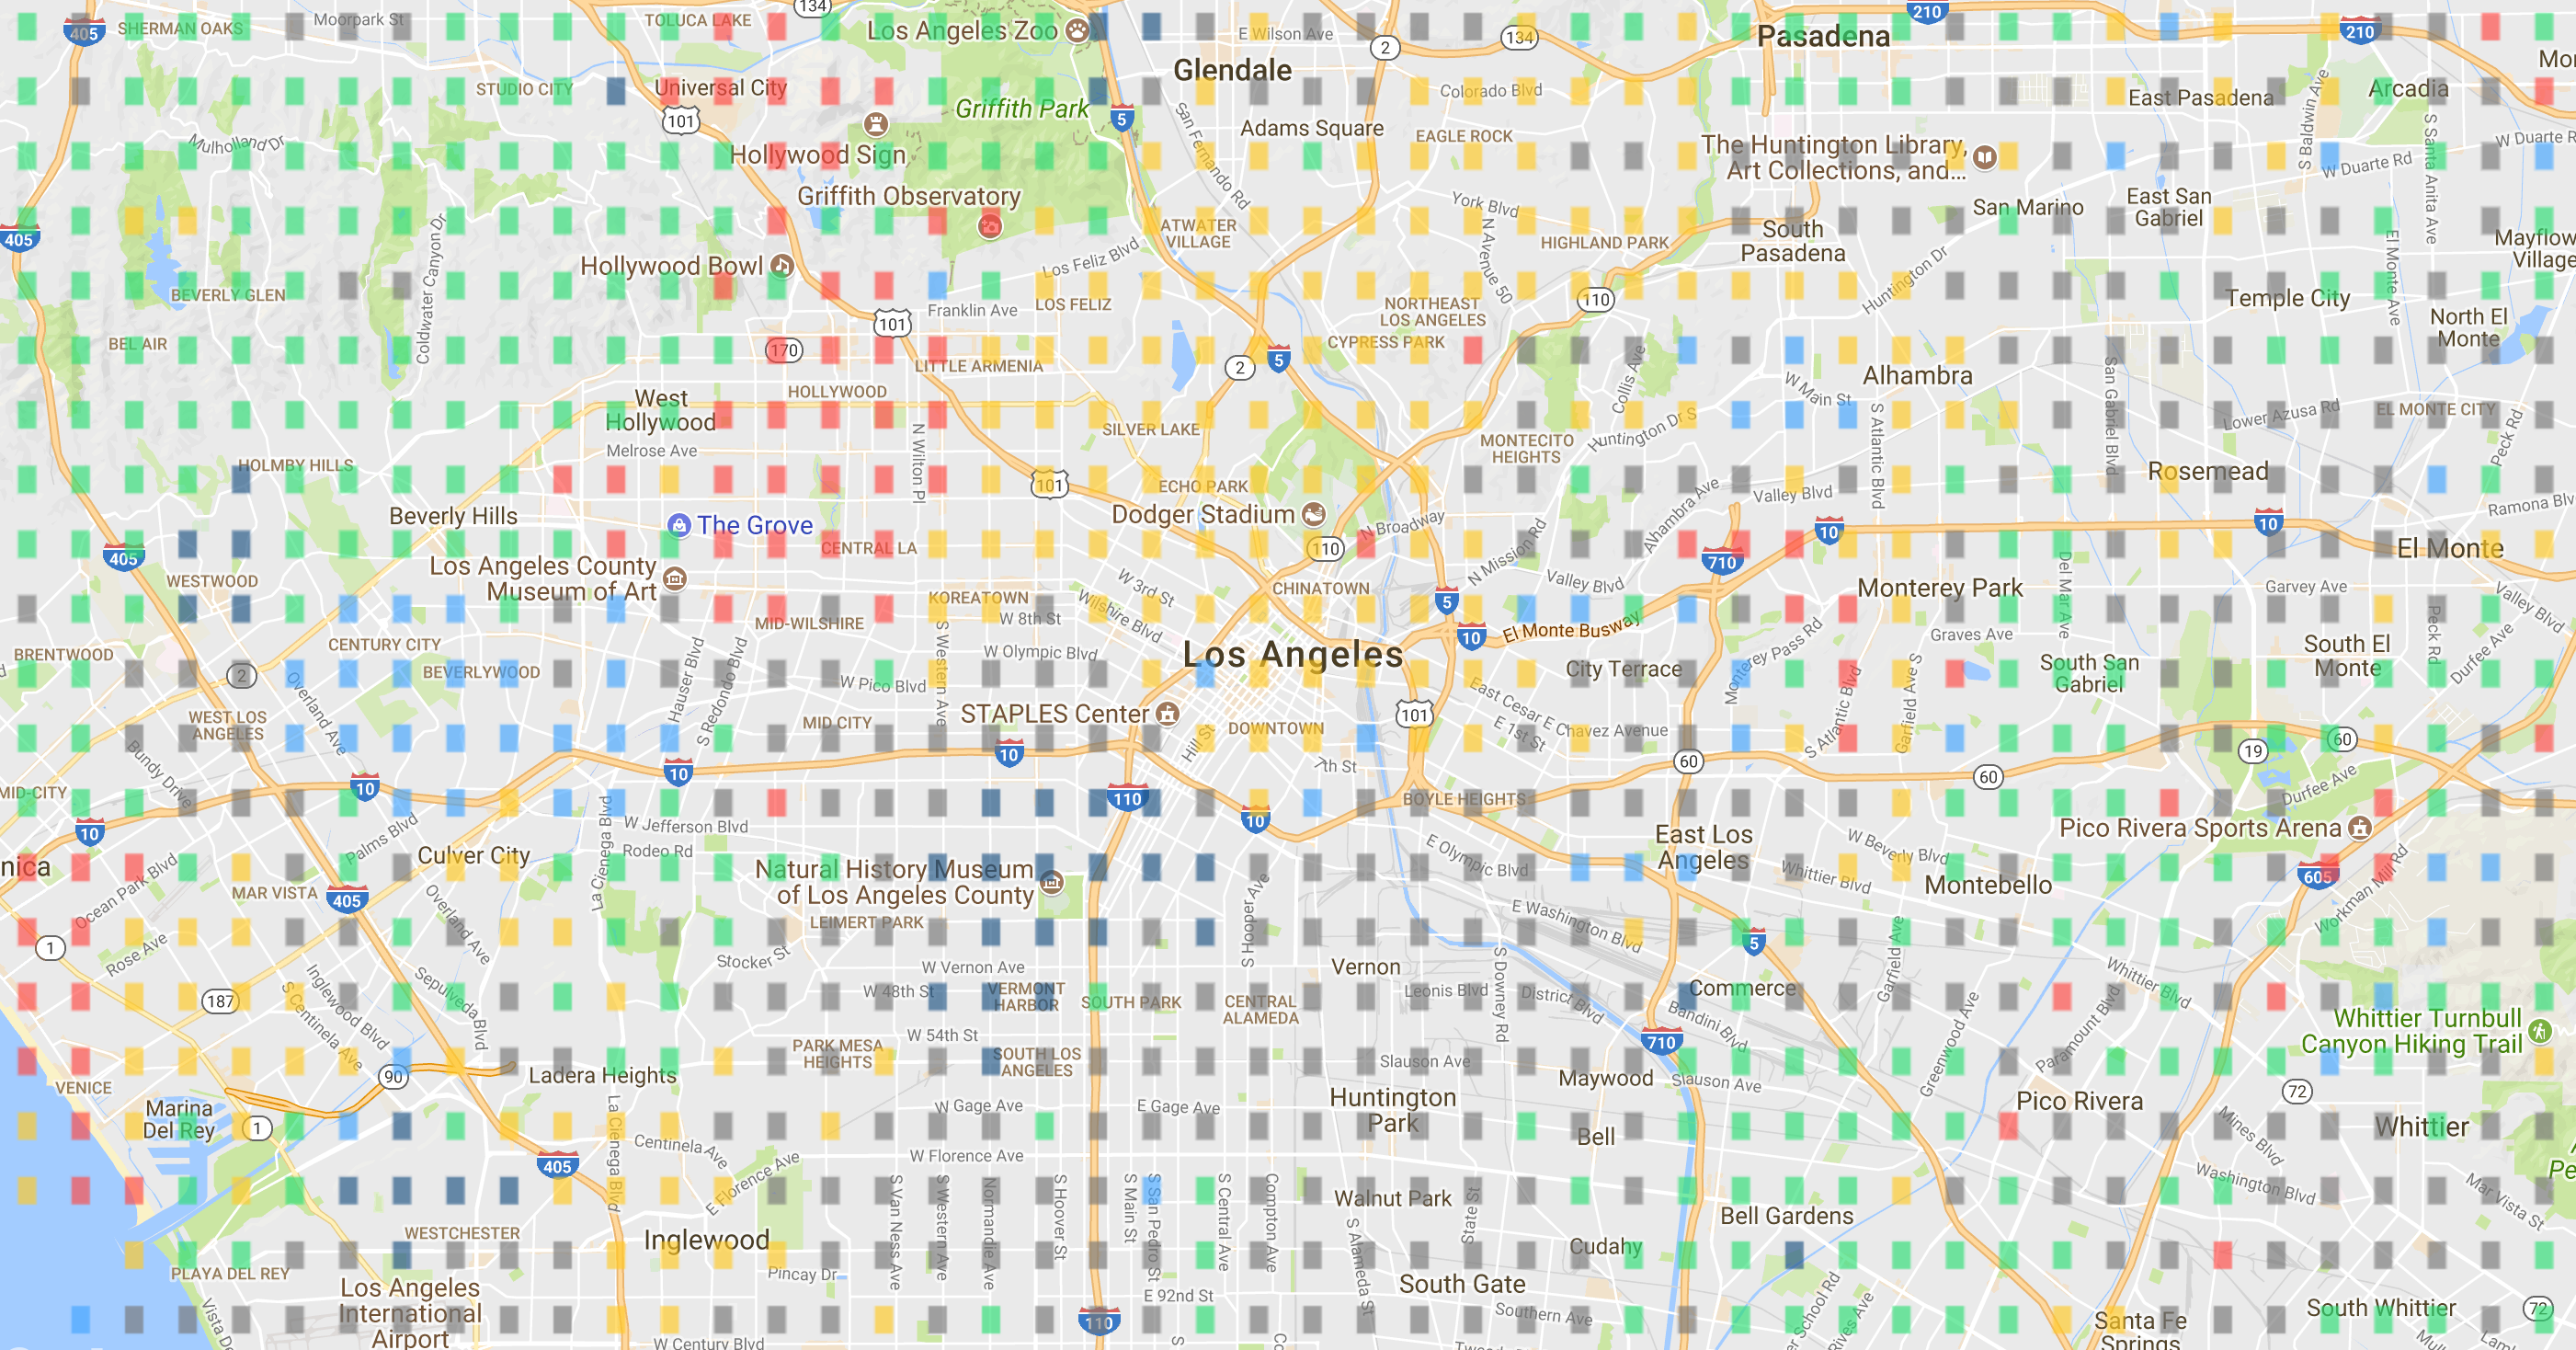
I save the drawing with it’s exact latitude and longitude coordinates (e.g. 52.37029884,4.8930113243). You can see the problem coming up. If I save everyone’s coordinate so precise, it becomes a mess of dots:
It looks kinda cool if you have lots of data, but obviously not useful:
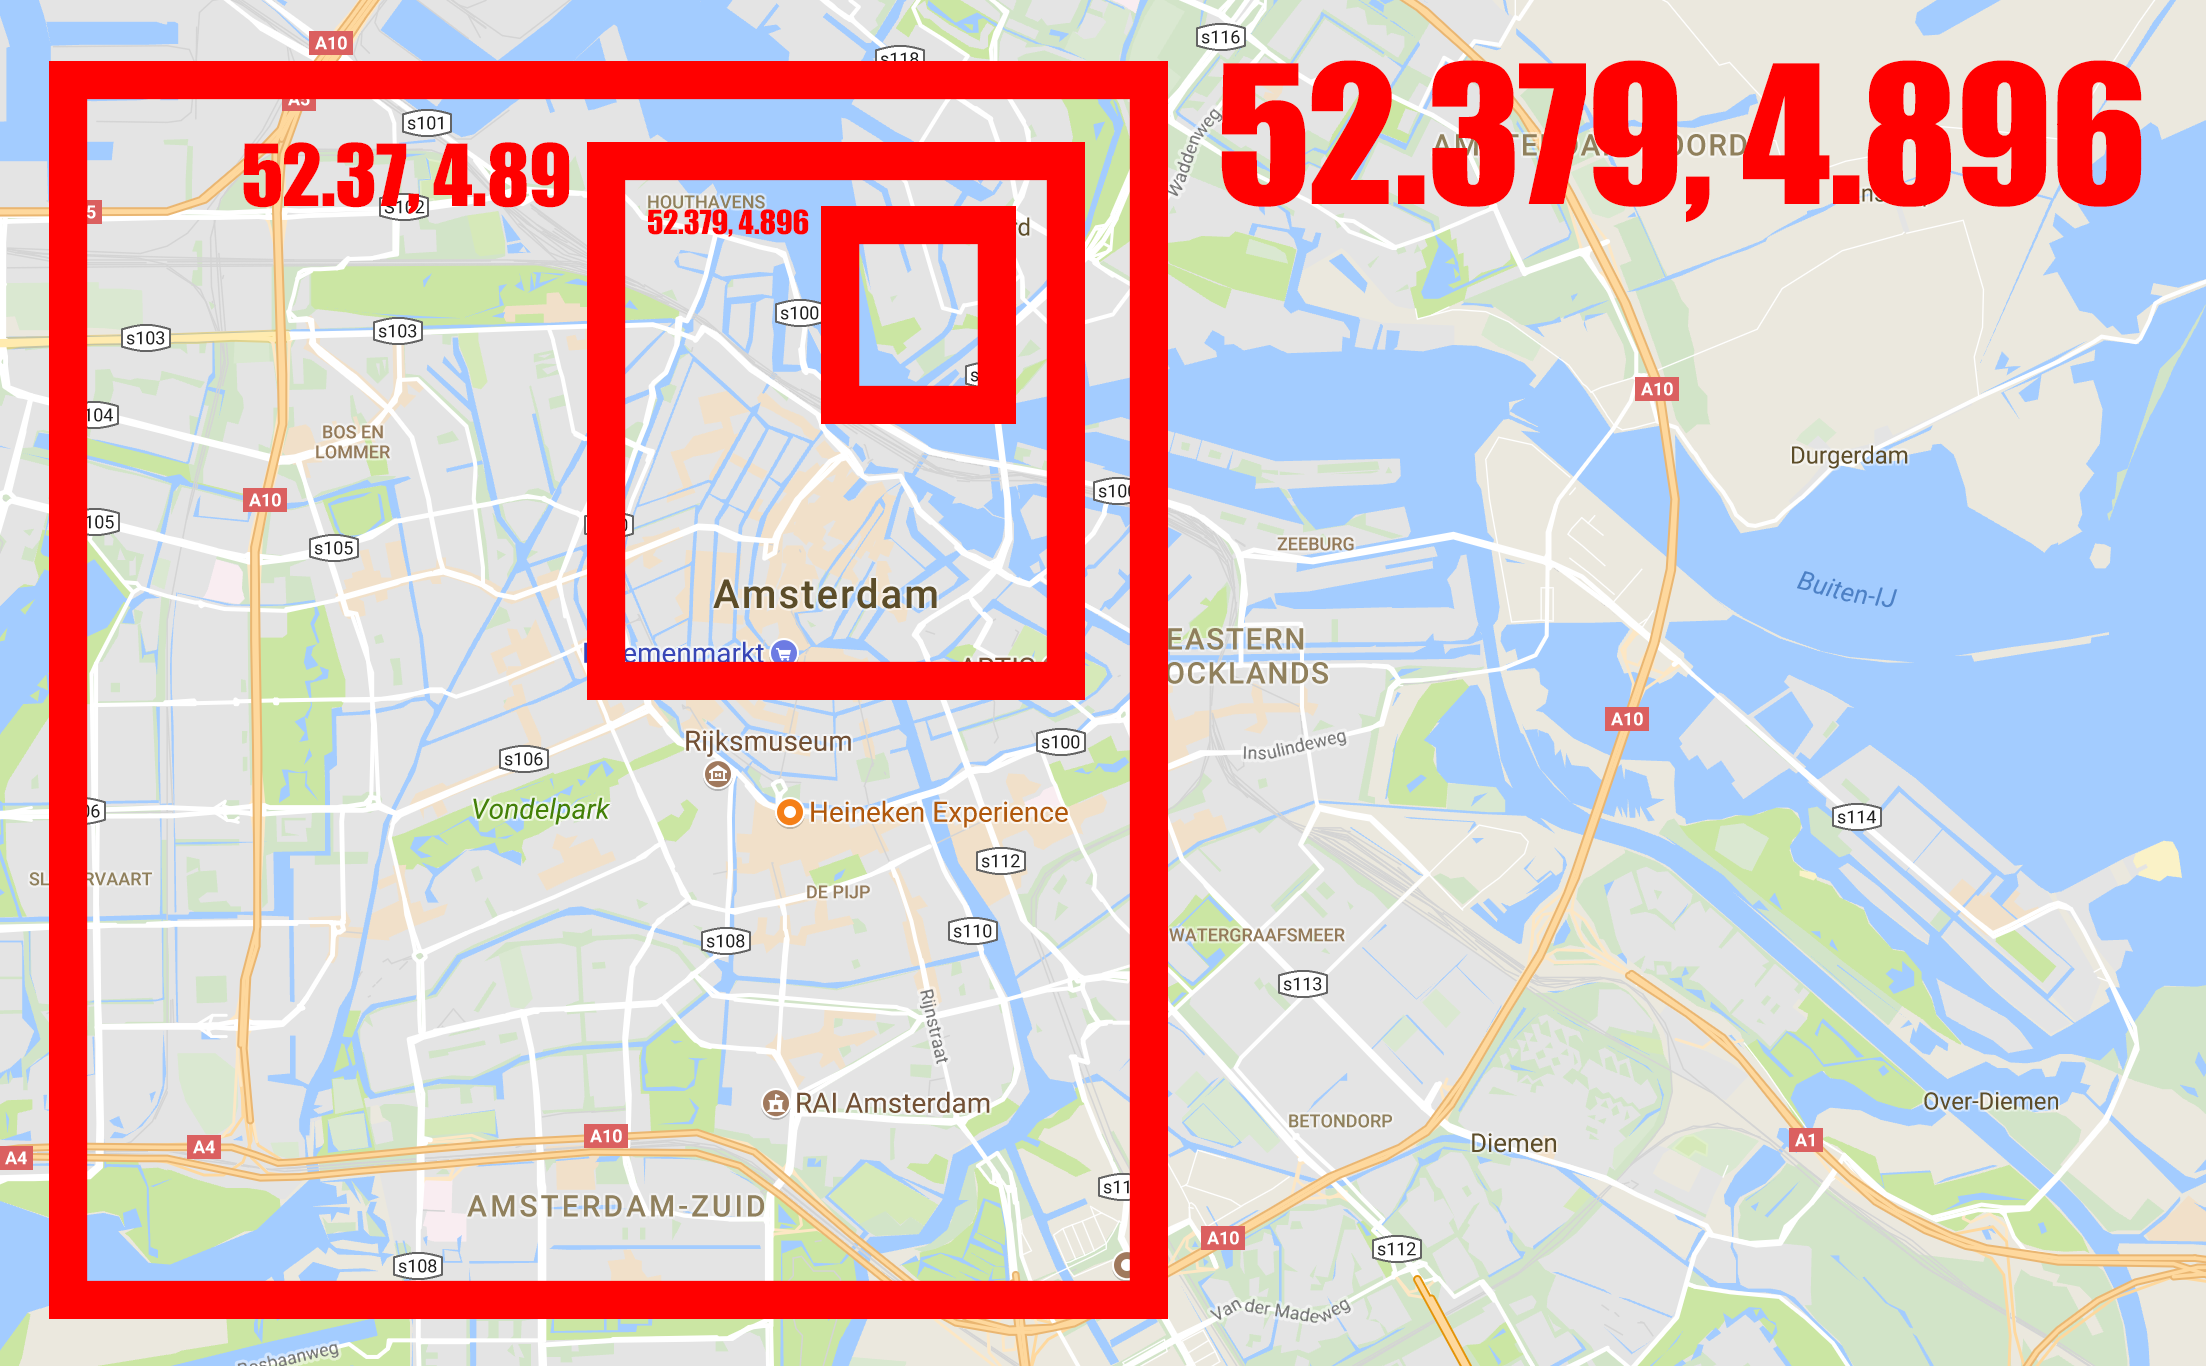
I thought for a while how to fix this. I could cover the earth in my own grid of dots that would specify areas. But all this stuff seemed way too hard and meanwhile there was 100 people watching on the stream waiting for me to fix this ASAP. So I thought of a super trick: I just remove some decimals from the coordinates. So (52.37029884,4.8930113243) became (52.370,4.893), even further (52.37,4.89) and then (52.3,4.8). With every decimal removed you have an area about 10x more that it covers, see:
The problem is you get a grid:
To fix that, I just increase the brush size until it covers the gaps:
The size of the brush is dependent on which zoom level you’re at. With a lot of playing around I came with this formula which generally makes each dot on the map big enough to cover any gaps:
brushSize = Math.pow(2,map.zoom)/125;
Where map.zoom is Google Maps’ zoom level, e.g. 14 is pretty deep, and 3 is seeing the globe.
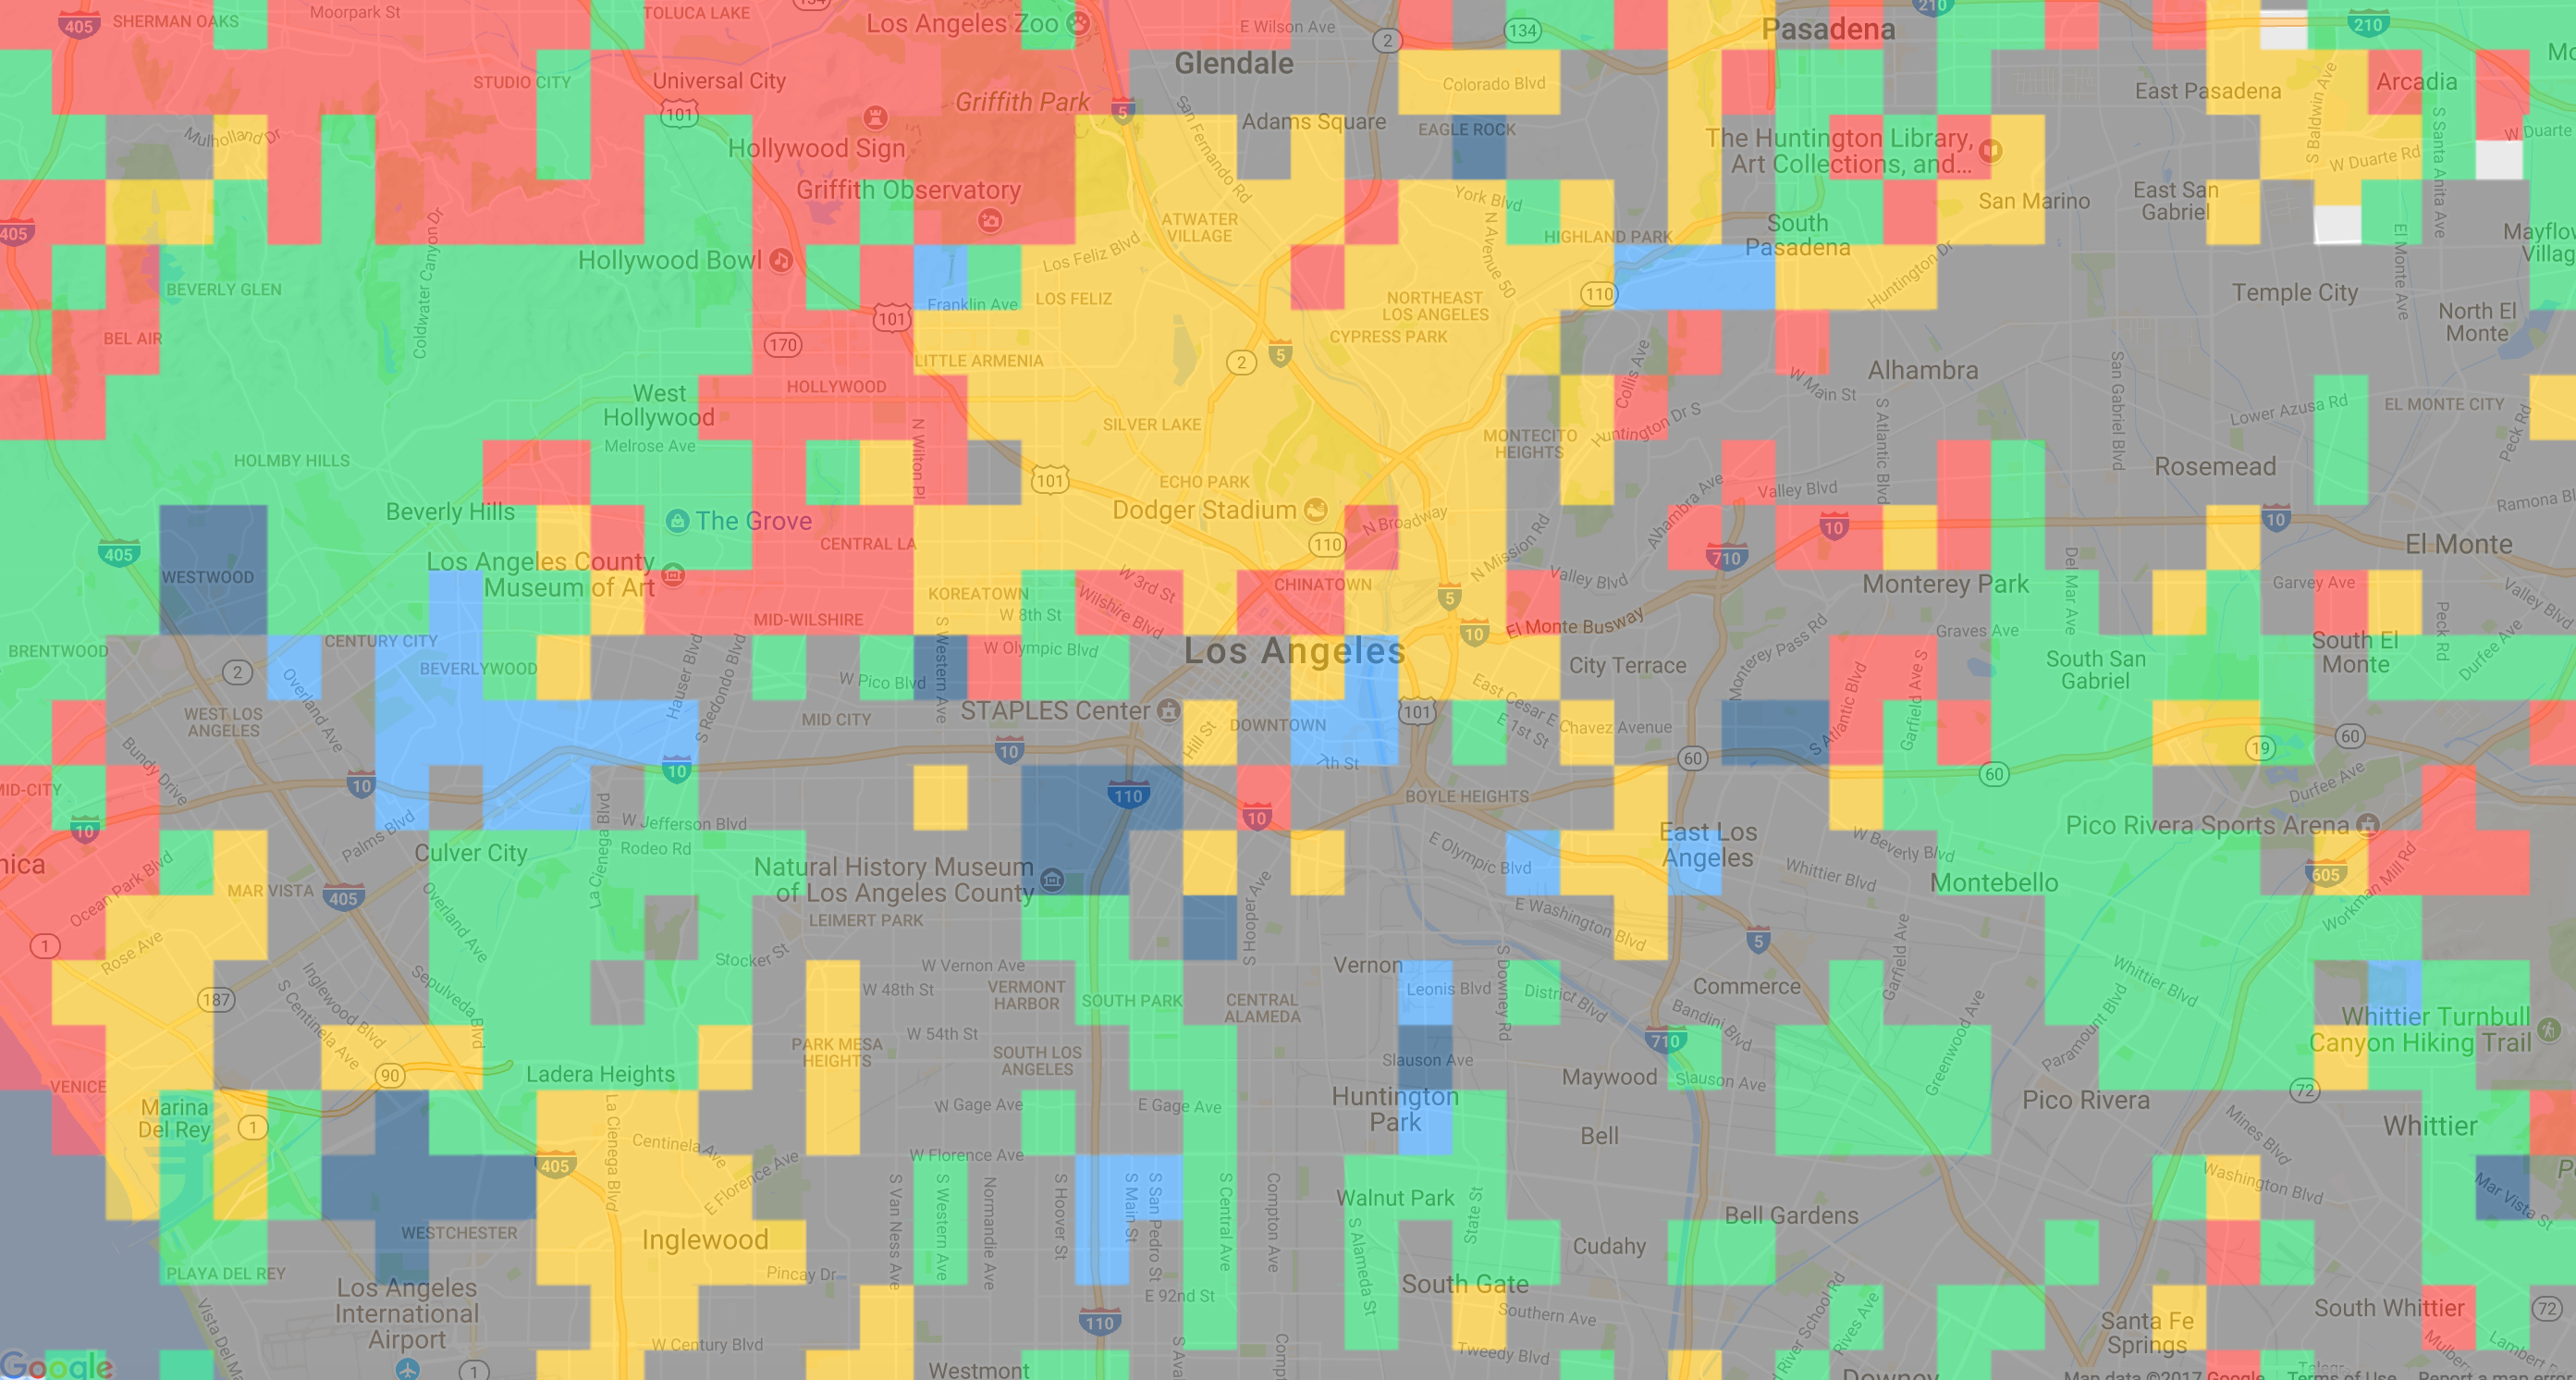
Another trick I did is at zoom levels above 12, which is near street level, I’ll first draw the rough normalized data (e.g. 53.233,4.138):
…but then after it I’ll draw data that was drawn at zoom levels above 12 in a smaller brush over it:
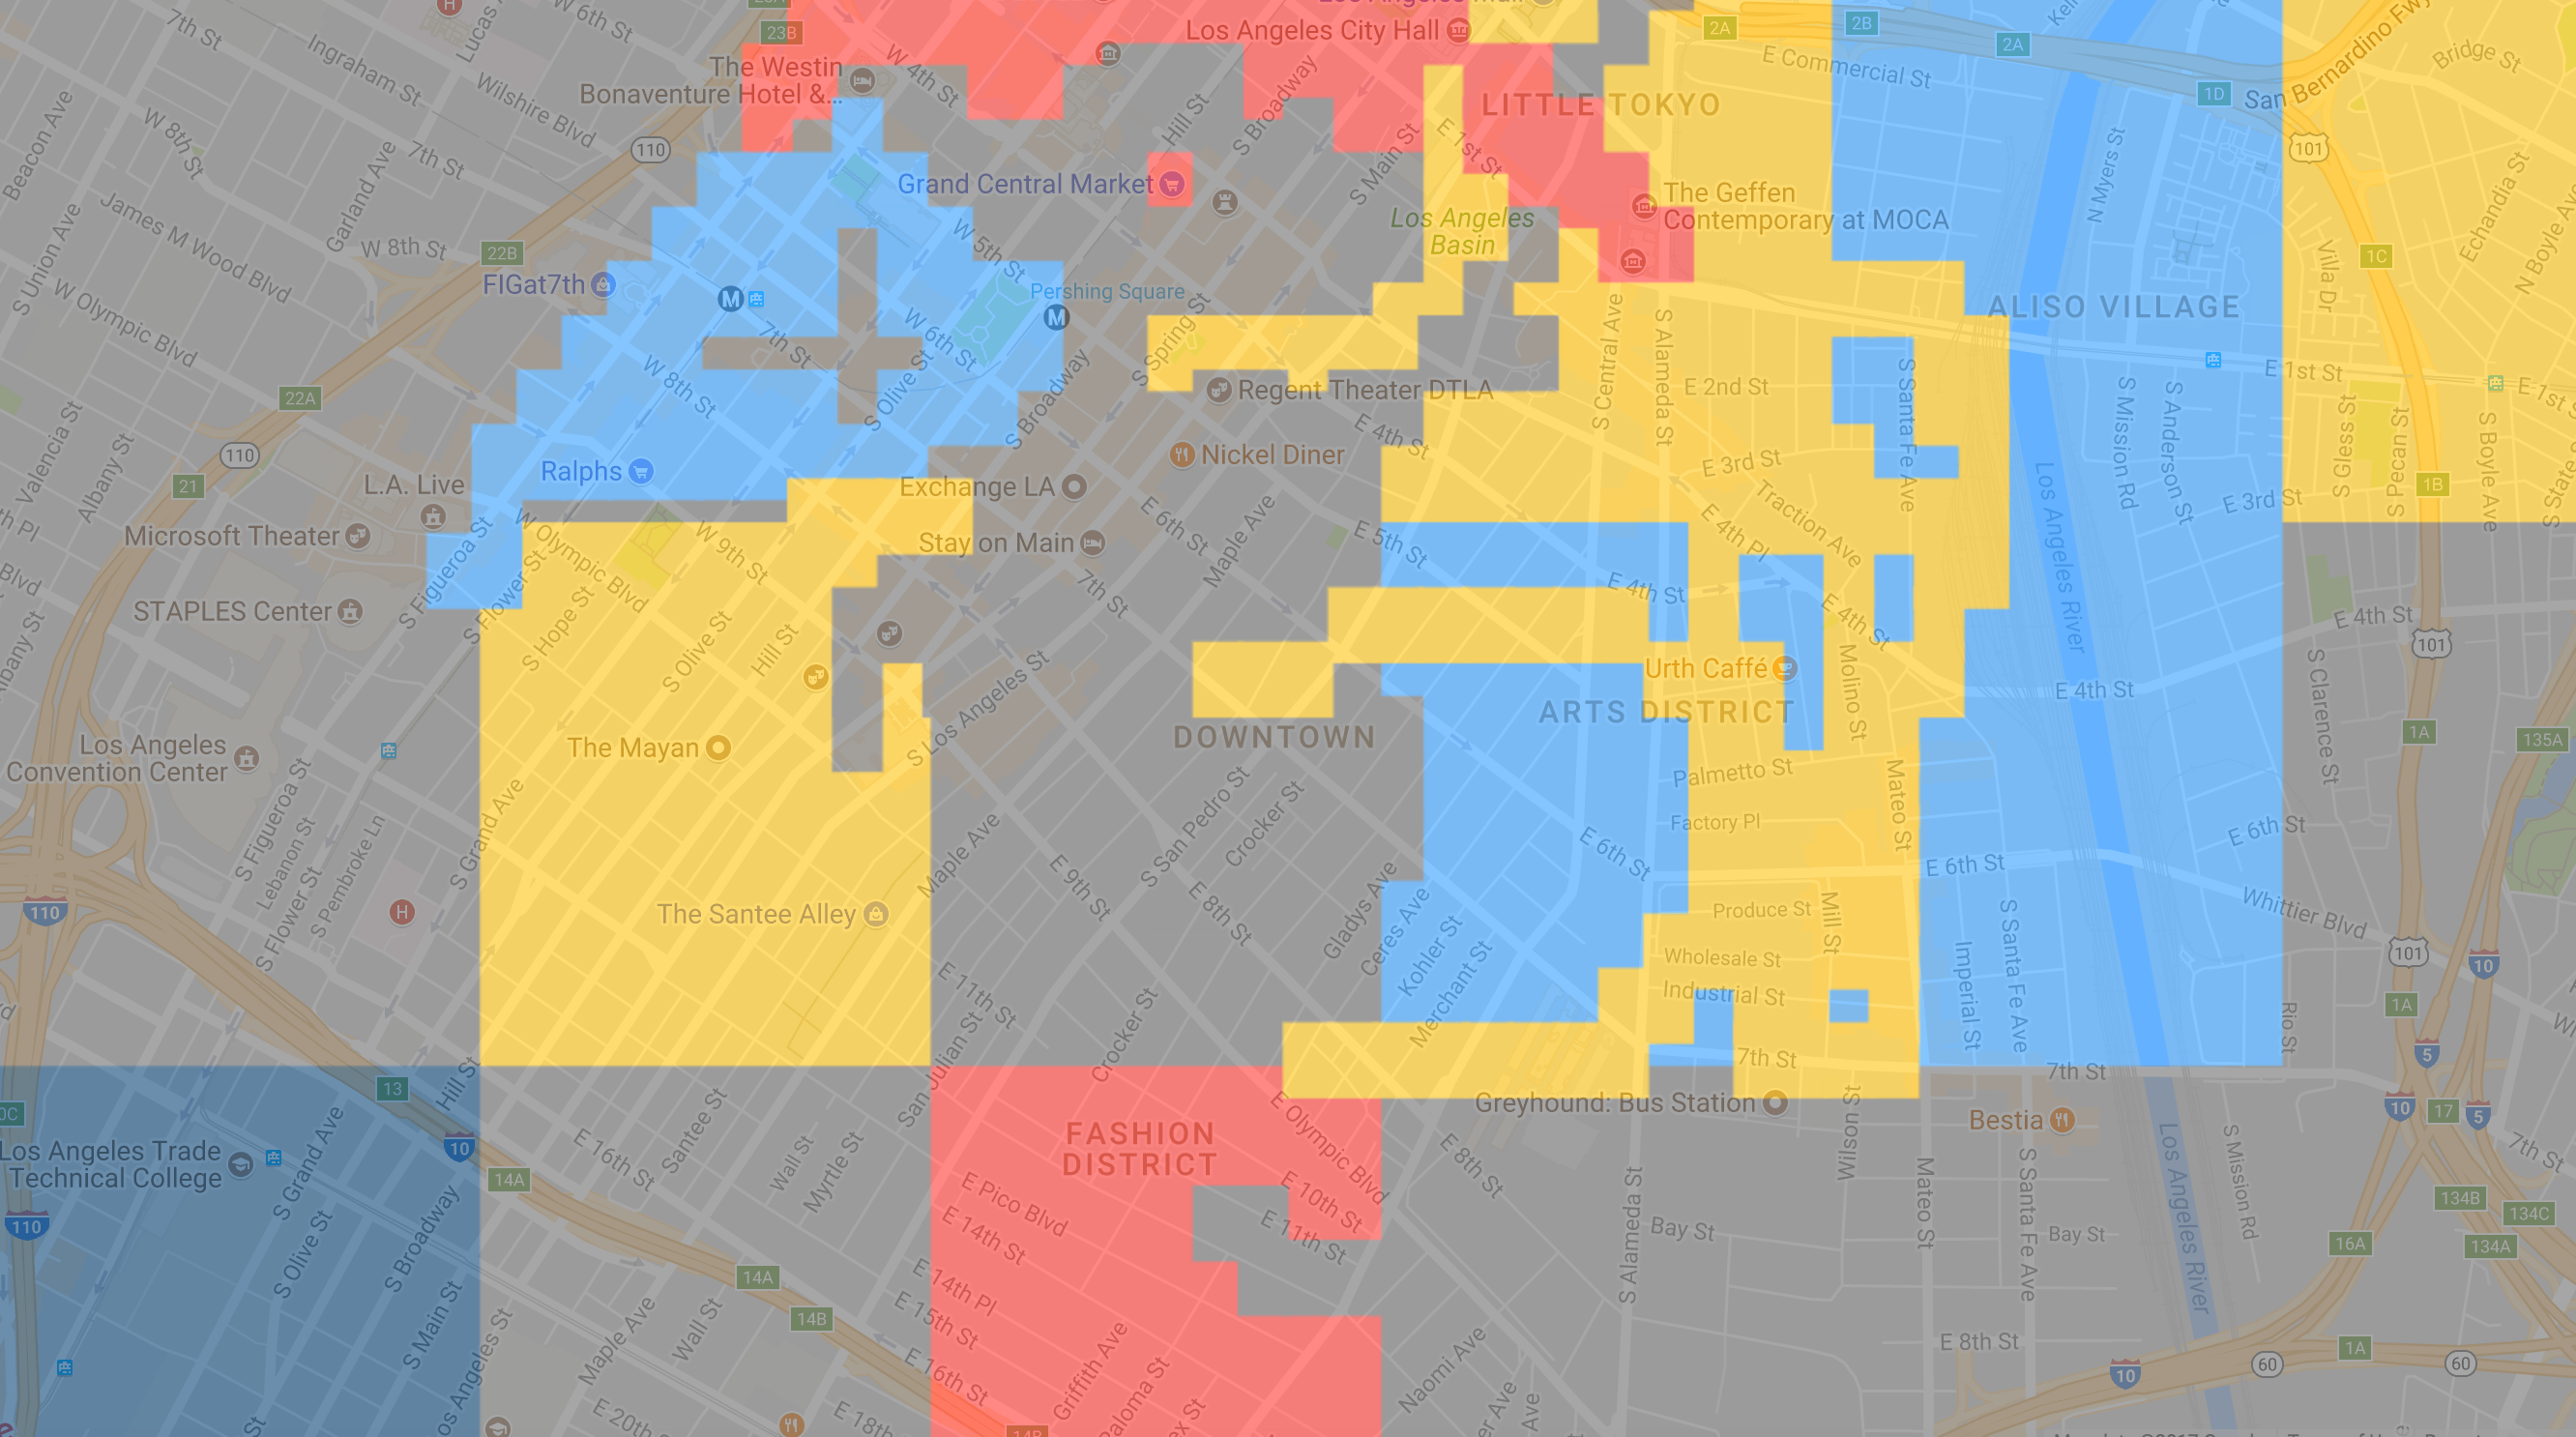
That means you’ll see an entire area be yellow on zoom out, but when you zoom in, you’ll see it with a backdrop of yellow but specific detailed colors added. For example the area is yellow (hipster) but that one street is blue (business). This gives dynamic detail without messing up the big overview of the city when zoomed out!
If an area block is actually brushed at this zoom level with more people saying it’s blue (business), it WILL change the entire normalized block above it and the whole thing becomes blue.
Layout
I kept the layout pretty basic. The top has the legend, but the legend is also clickable and sticks out if it’s active:

If you click it you’re in brush mode. I added a Photoshop-style brush cursor because browsers don’t have one built in:
removed emoji, just a photoshop style circle now pic.twitter.com/Xvp7kznsaM
— Pieter Levels @ 🇺🇸 (@levelsio) April 6, 2017
The CSS for it was simply a div as a circle (border-radius:100%) with a border (0.5px solid rgb(0,0,0,0.35)) to emulate Photoshop’s brush cursor:
.brush {
display:block;
width:0.8em;
margin-left:-0.5em;
margin-top:-0.5em;
height:1.1em;
box-shadow:0px 0px 2px #fff;
border:0.5px solid rgba(0,0,0,0.35);
border-radius:100%;
}
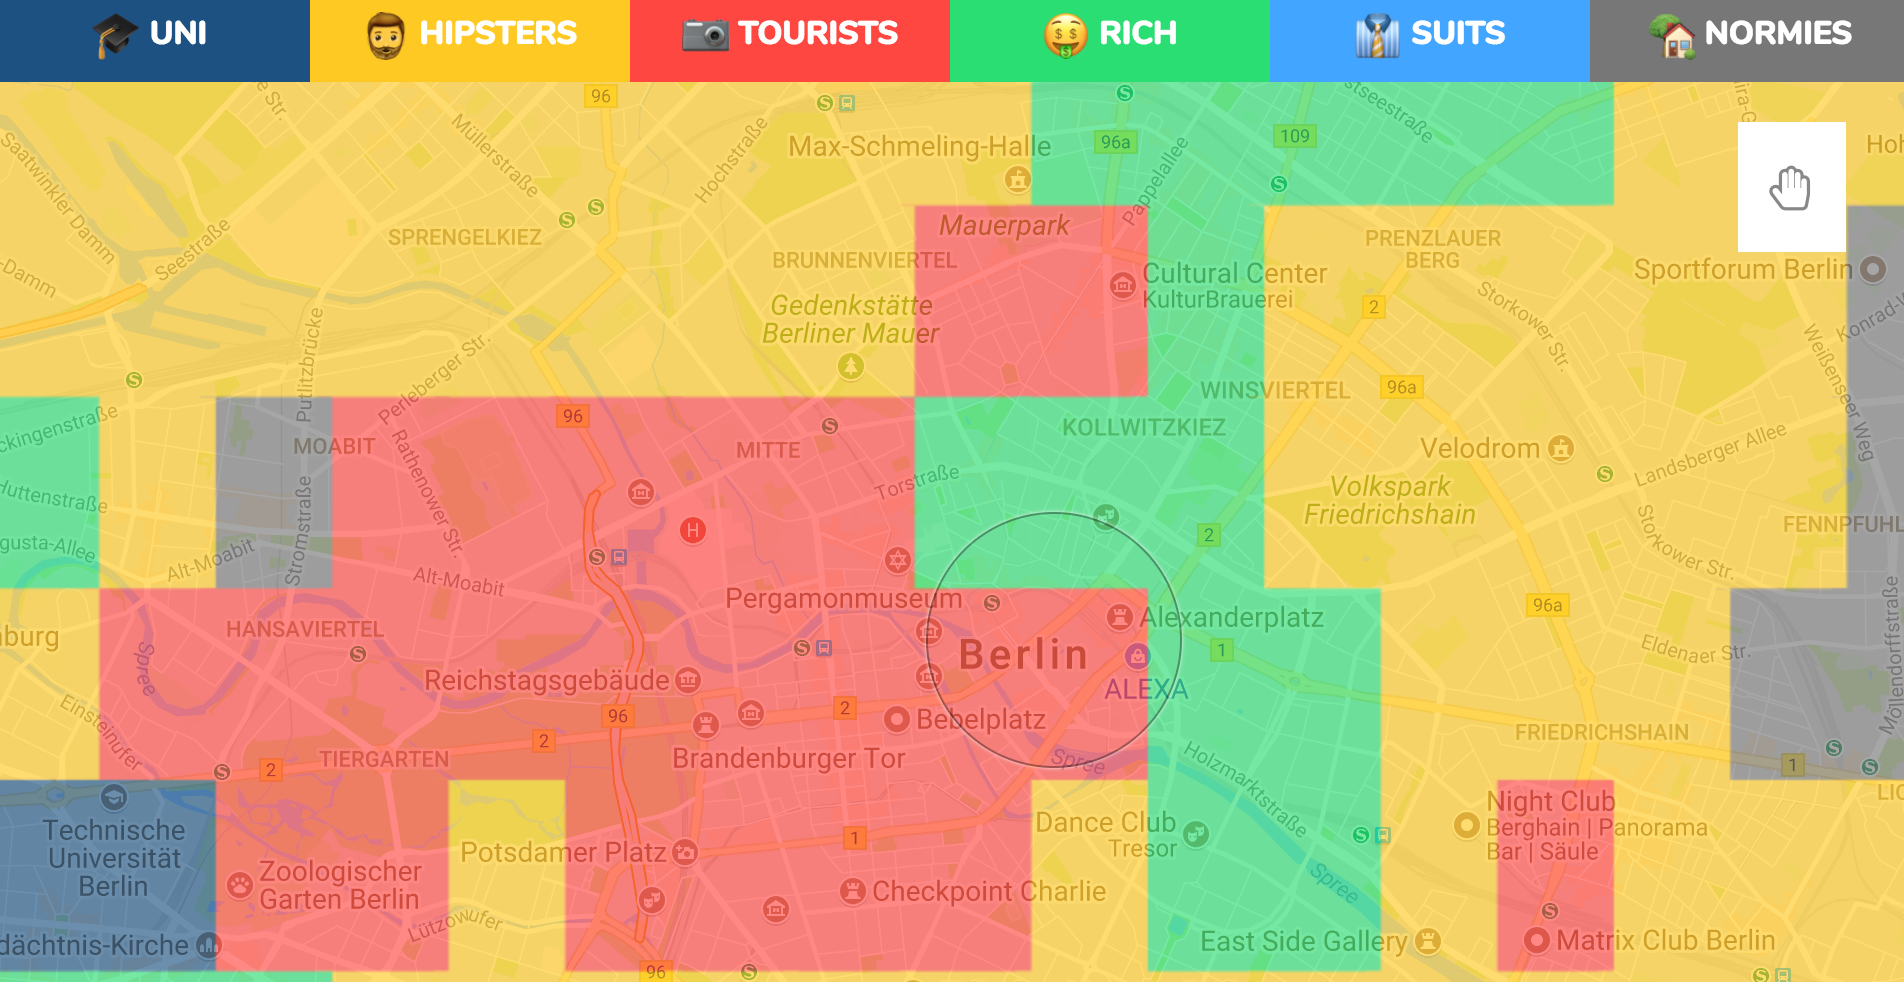
If you click the drag (hand) button, you go back to drag mode.
There’s also a brush button to directly start brushing. It’s all really just remnants of Photoshop in my memory:
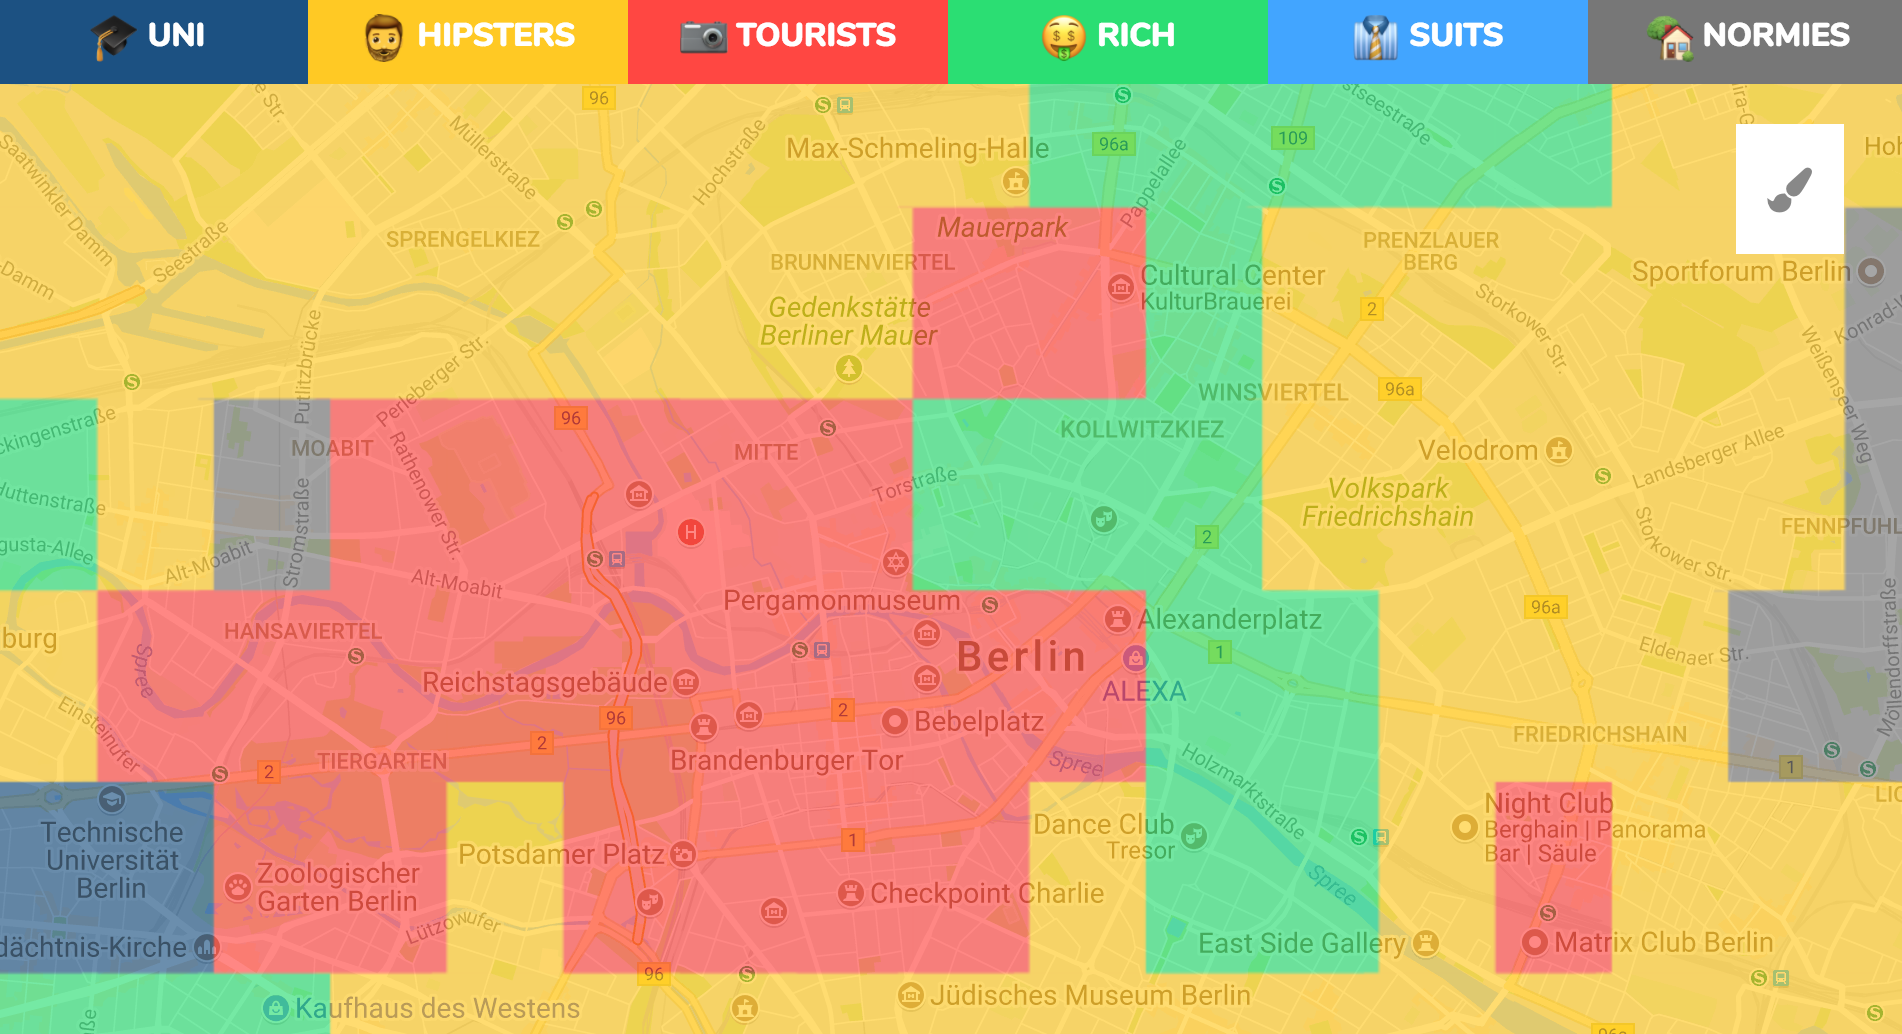
Blur
The pixel stuff looked cool but it didn’t make sense that one area had a sharp edge where it turned from “hipster” into “tourist”.
So a week before launch, I decided to try just adding a big blur to the drawings. To make it more gradual:
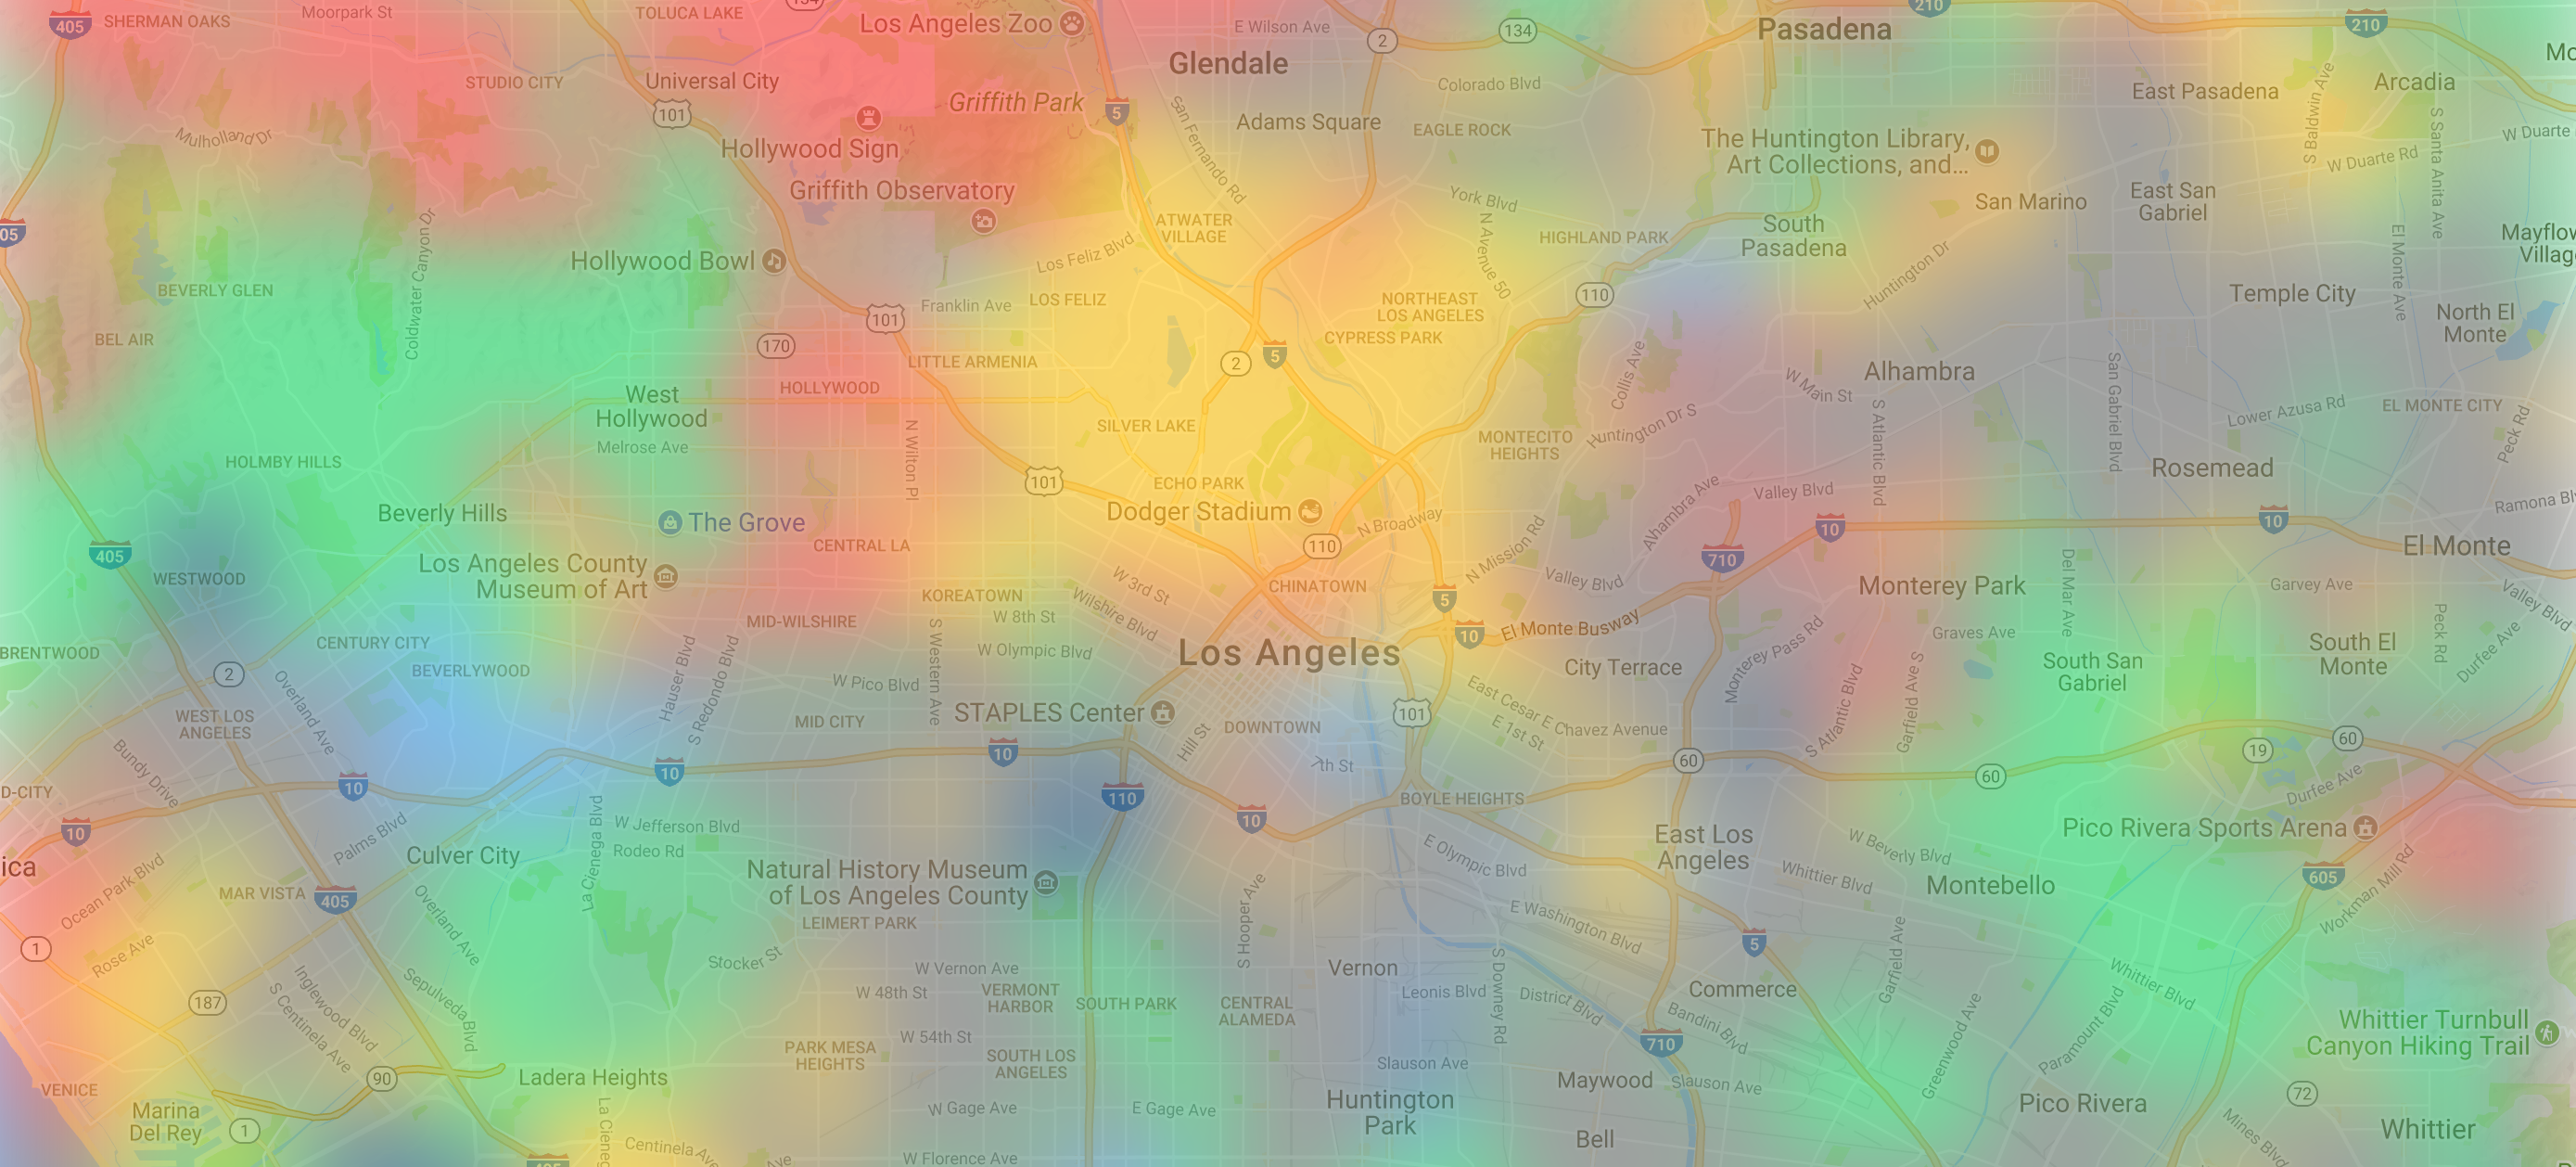
This had a big effect. It made it look less clean but it made it a lot more practical and valid in terms of data. Because the data ISN’T precise, so visually blurring is more honest. The drawing also became literally like a Photoshop soft brush. Overall, a better experience. Luckily, it’s just a CSS filter now:
.map-canvas {
-webkit-filter:blur(25px);
-moz-filter:blur(25px);
filter:blur(25px);
}
Pre-launch traction
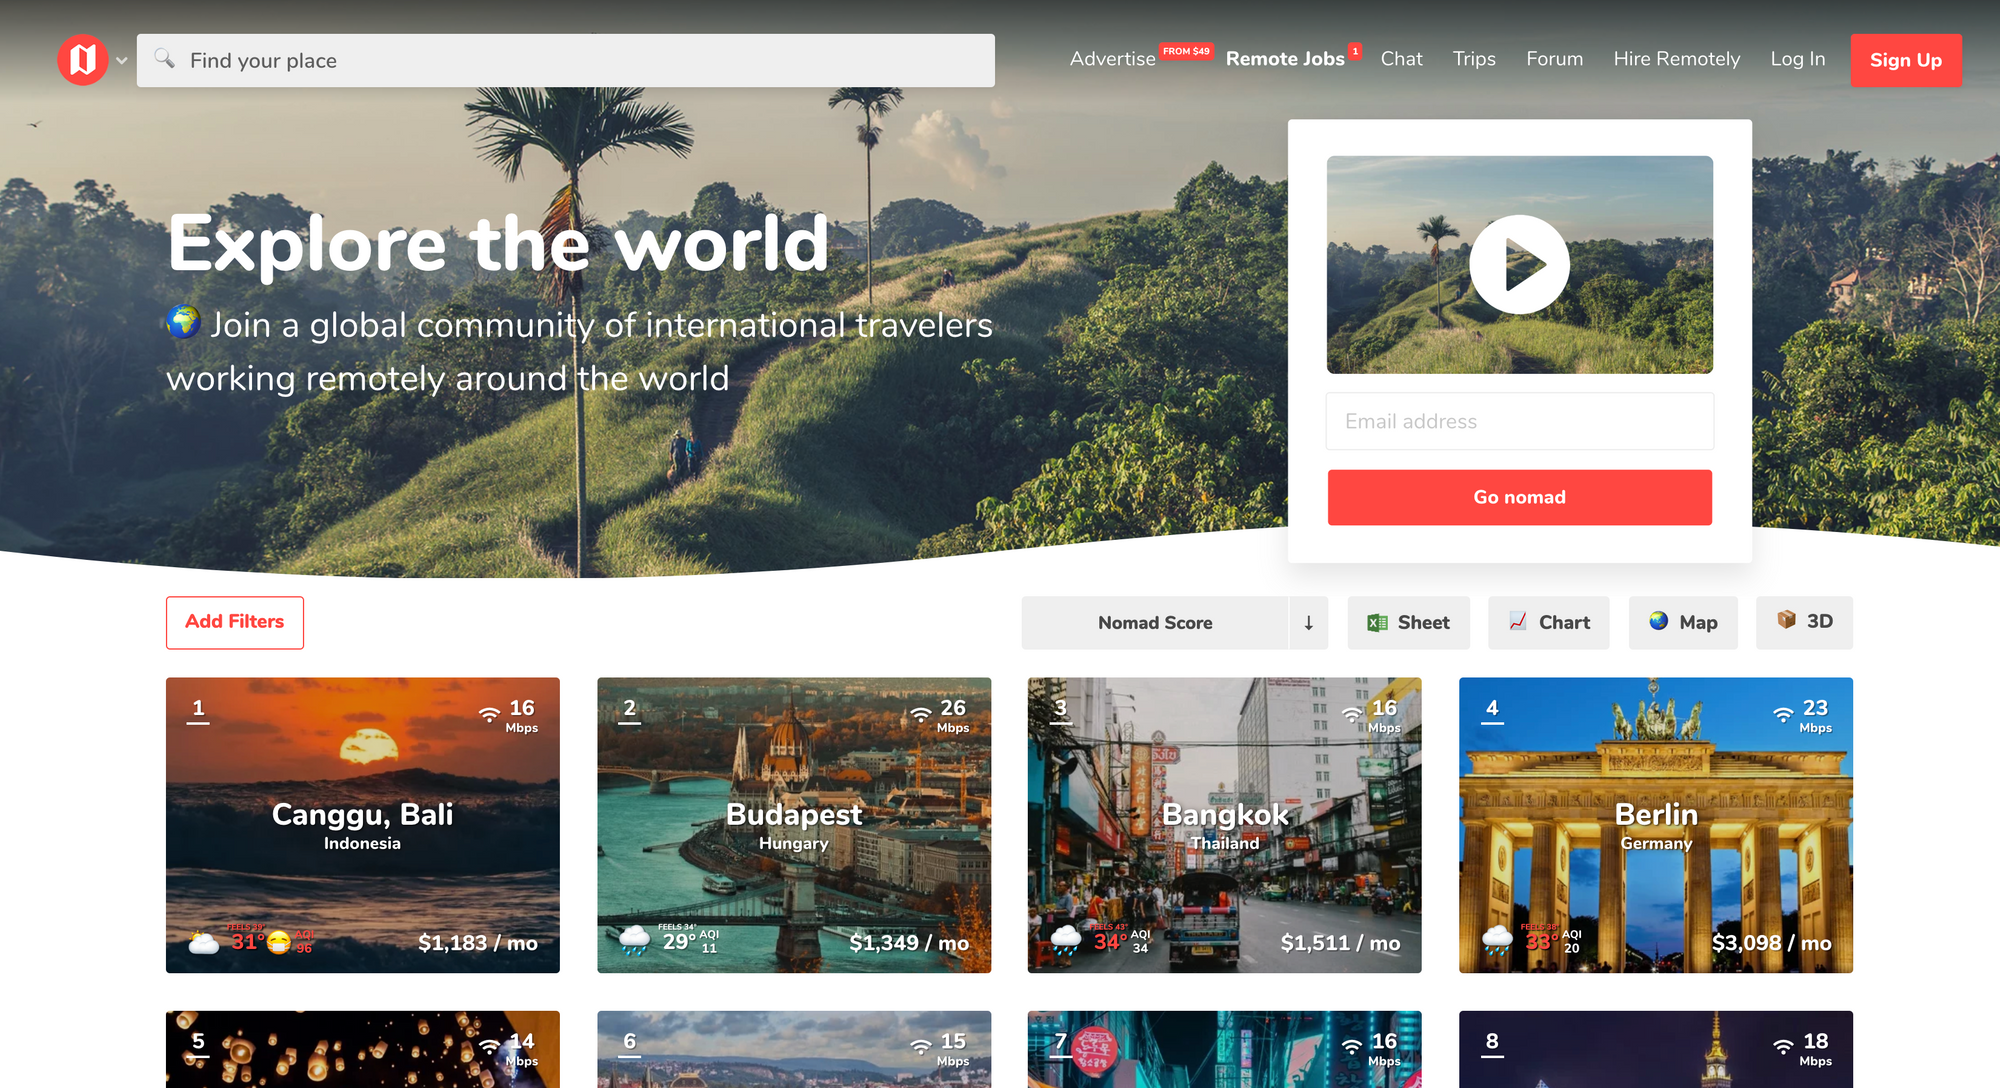
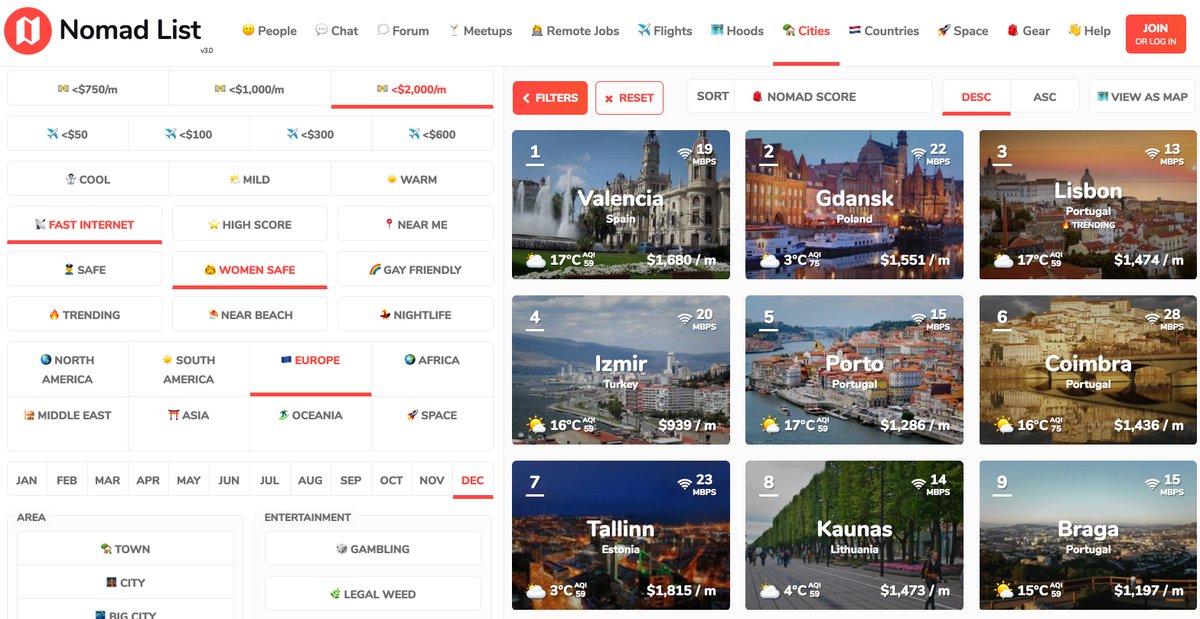
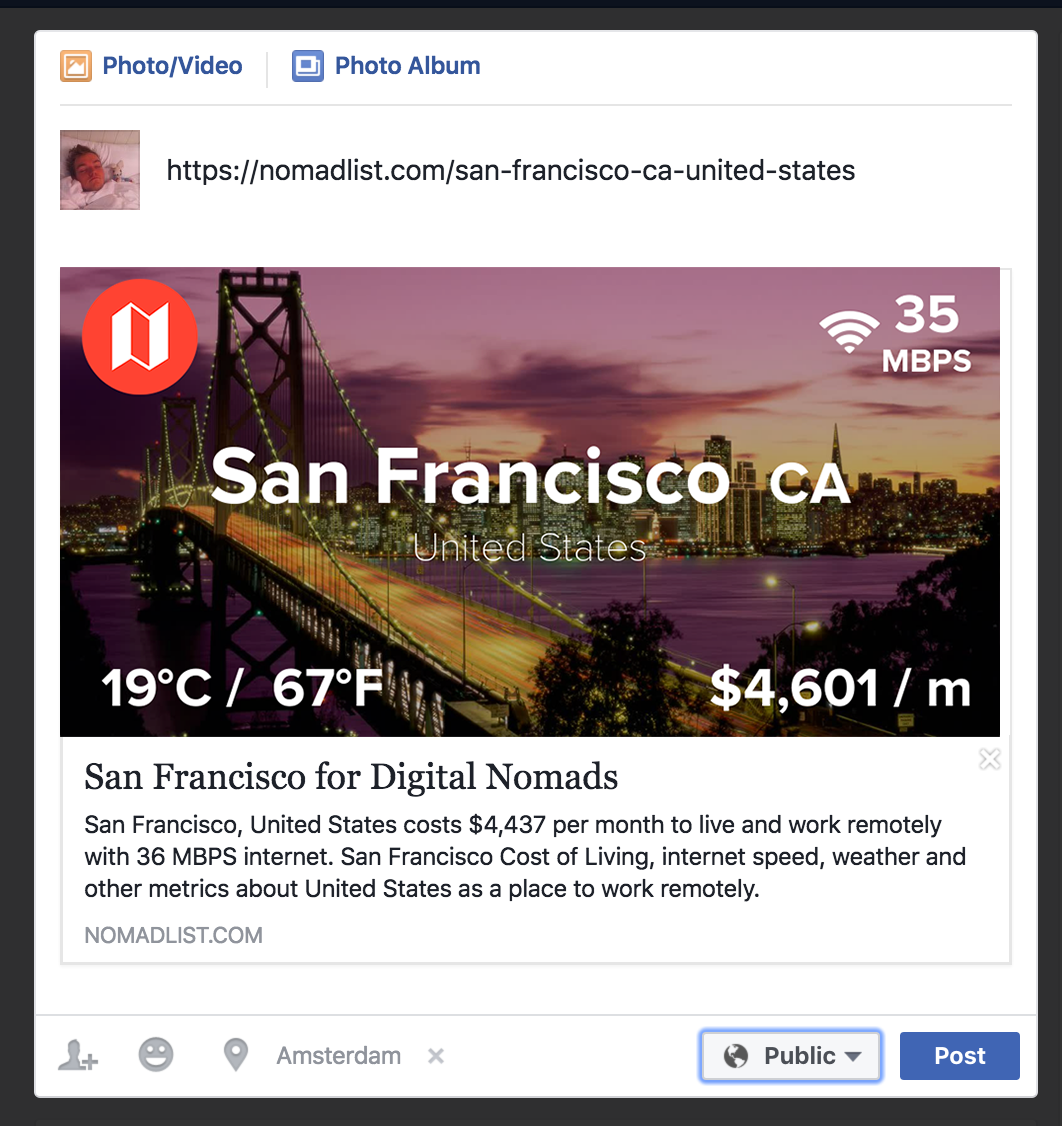
With the basic app finished, it could now let you color any place in the world, save it and show you the crowdsourced results, I embedded it on my site Nomad List under each city’s page as “neighborhoods”:
This gave it some basic early traction, and more importantly would pre-fill the data over a few months. P.S. whenever you have a previous product WITH traction that you can use to give your new product traction, do it!
Adding tags
The site was now pre-launch but live. It was doing okay:
…but I needed some extra magic to make it get real traction by itself (not just through Nomad List’s embeds).
I accidentally found that magic in tags.
What are tags? Well, to give more information to the maps I wanted to add a tagging functionality. A tag can describe a location or area with someone’s opinion. Like “hipster student area with lots of coffee shops” or “dodgy area better to avoid at night”. I wasn’t sure, so I asked Twitter first:
Should I add text labels to t.co/idCjeBF2zG? Here's a mock up. It'd give some extra meta data context? pic.twitter.com/h8SP8qJggU
— Pieter Levels @ 🇺🇸 (@levelsio) July 3, 2017
Technically, it’s simply the same database entry with coordinates but with a text label included:
epoch,user_id,latitude,longitude,label,uid
Epoch is the timestamp of when the tag was made. User_id is a unique fingerprint hash of the user. Latitude, longitude is the location. Label is the text string. UID is a unique key in the db which combines the user_id, latitude, longitude and label.
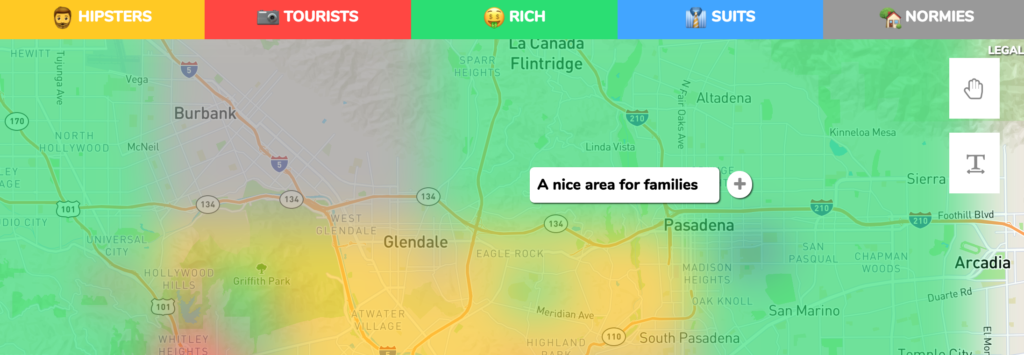
I also added a tool to add them in the user interface. A simple [T] button and a text box when you click somewhere that opens up. You type in a text label and when you press enter, it sends it to the server and it puts it on the map:
✨ Coded this while drinking 🍺 and it helped cause this was really difficult: add opinionated text labels about areas t.co/idCjeBF2zG pic.twitter.com/3ABxYCTGK8
— Pieter Levels @ 🇺🇸 (@levelsio) July 3, 2017
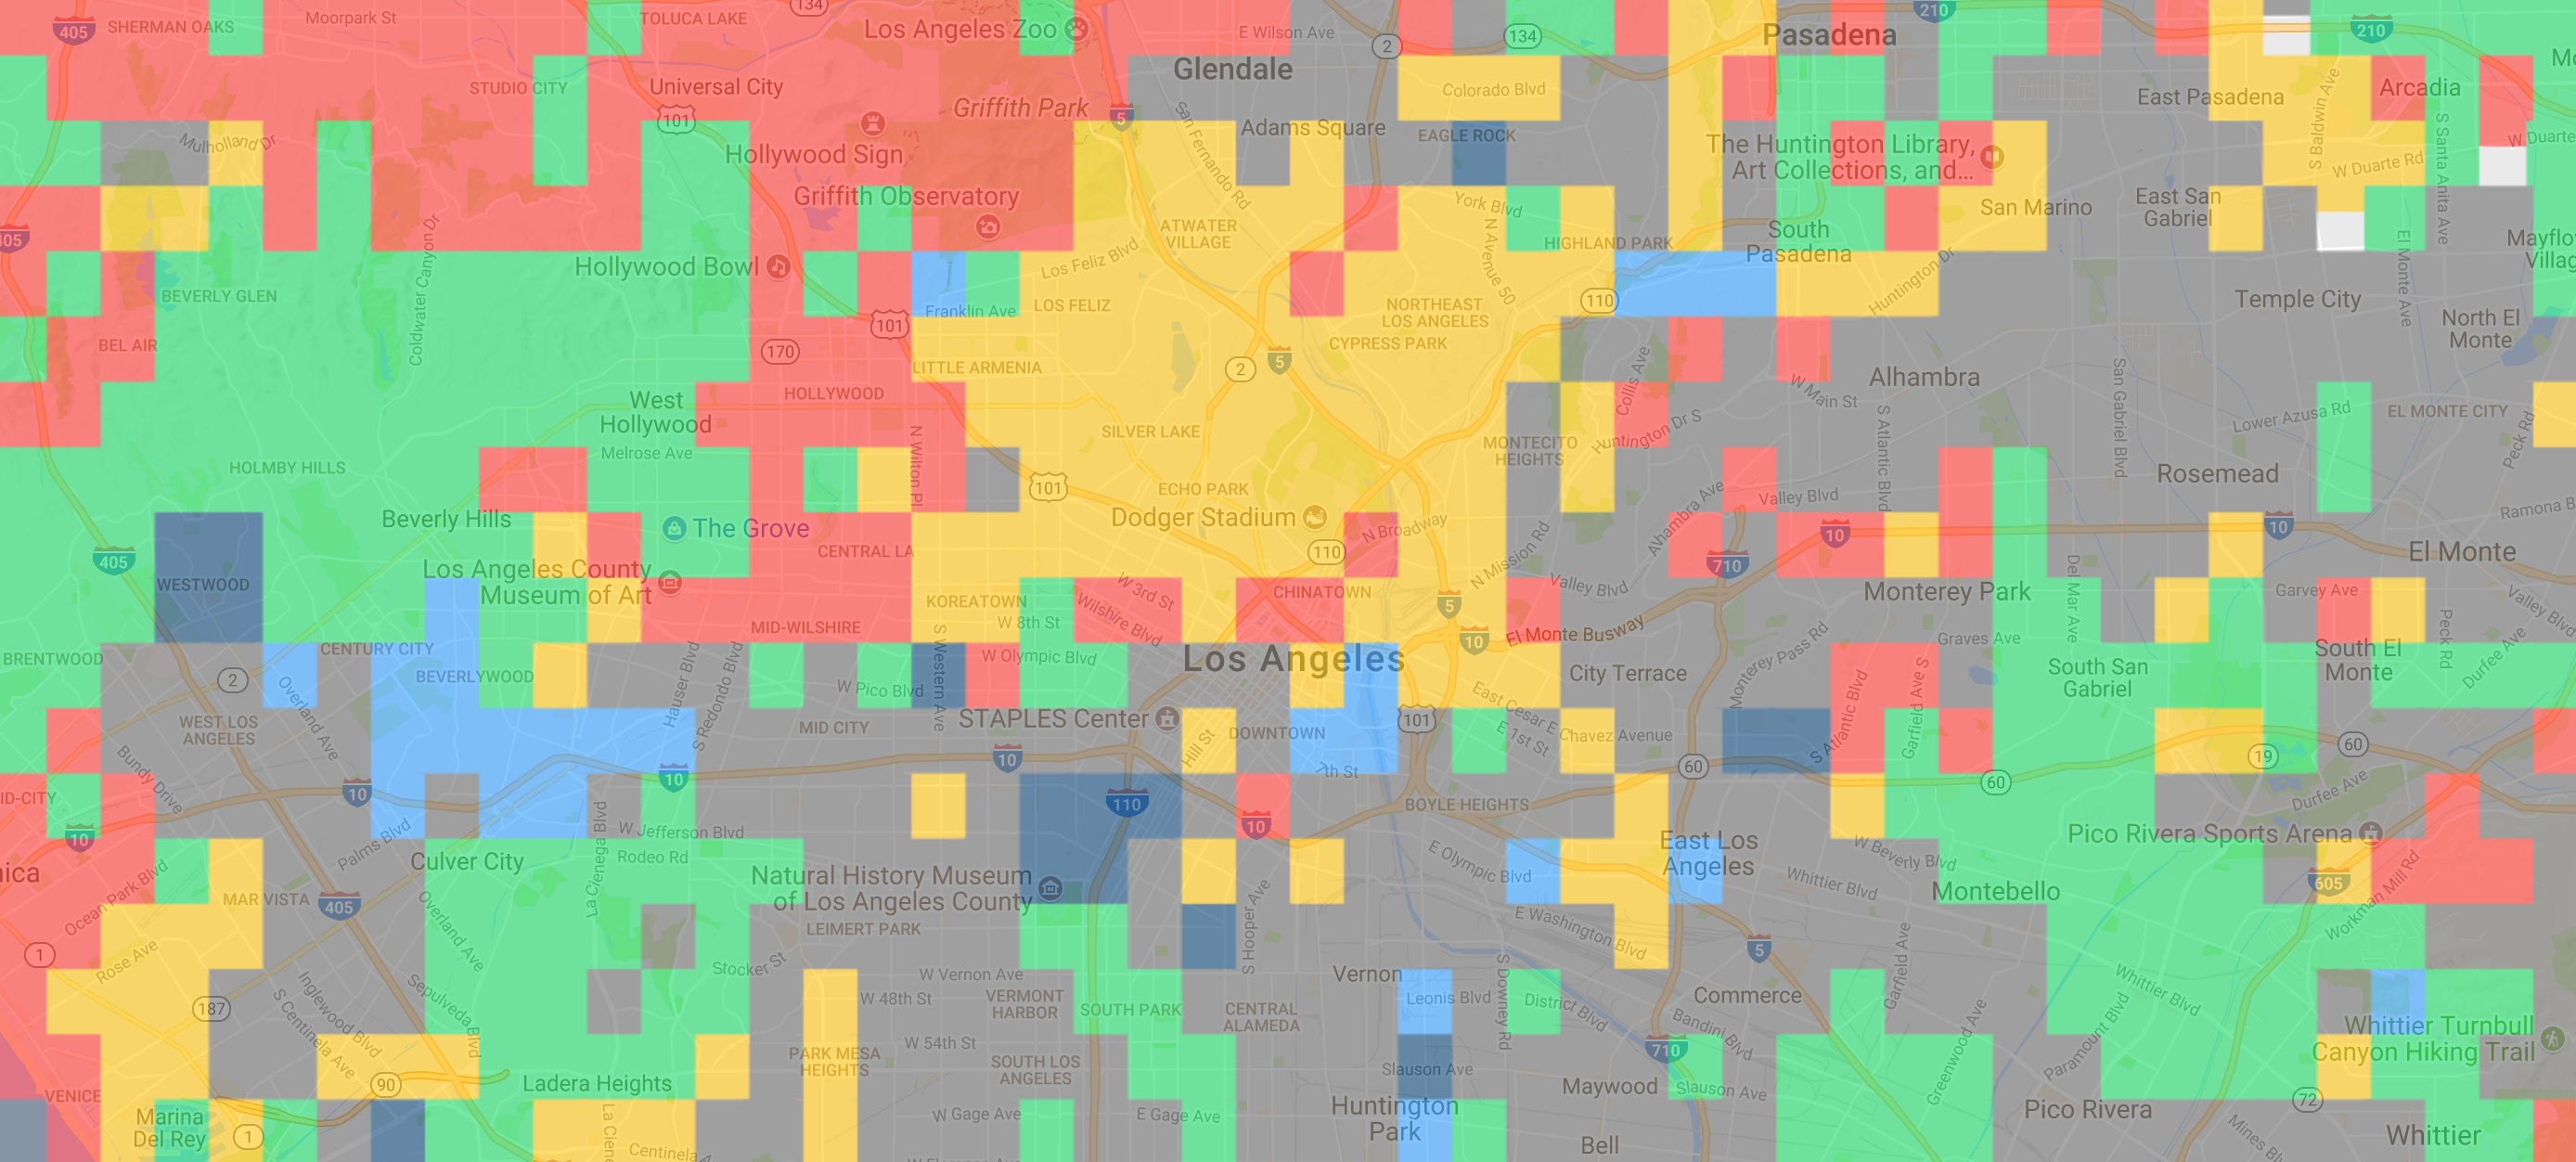
Suddenly it started taking off
Without even doing anything that resembled a launch, Hoodmaps Los Angeles started taking off by itself:
🇺🇸Los Angeles' people have discovered Hoodmaps and started tagging like crazy pic.twitter.com/yfLympAoS5
— Pieter Levels @ 🇺🇸 (@levelsio) July 6, 2017
Someone had submitted it to Reddit apparently:
Spammers
Then I got my first batch of spammers, which would be many more later:
Getting weird automated spam now like "unscalably set", fucking scriptkiddies 🙄. Will see if I can make an auto ban thingy pic.twitter.com/ccBIH3xRzF
— Pieter Levels @ 🇺🇸 (@levelsio) July 6, 2017
all auto generated weird word spam, no idea why pic.twitter.com/uJOUg6Aodq
— Pieter Levels @ 🇺🇸 (@levelsio) July 6, 2017
It turns out they automatically submitted 205,603 tags like “brontometer unretractable Pharisaism”. Complete bullshit.
I tried reCAPTCHA, but it would clog up the interface too much. So I wrote my own cryptography magic in JS. It simply makes sure it’s actually a human who is writing it based on many human cues. It’d be hacked within minutes if I was Facebook, but since I’m just a small site nobody really cares.
I also added upvoting and downvoting of tags, hopefully people would downvote spammy tags:
✨Added @reddit-style upvoting for text labels, that means anyone can now add labels and others can upvote/remove 'm 😱t.co/idCjeBWDYg pic.twitter.com/J2LWVobtmc
— Pieter Levels @ 🇺🇸 (@levelsio) July 3, 2017
Spam solved! For now…
Domain name
I now had hoodmaps.io, hoodmaps.org, hoodmaps.net but not hoodmaps.com:

But they were asking $1,795 for it! INSANITY! I emailed them with an anonymous address and bid $1,000:
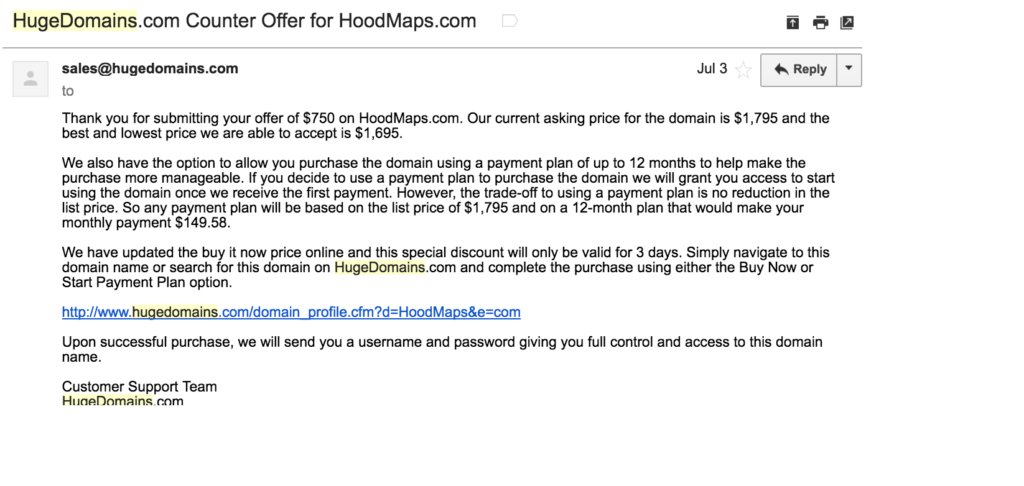
WHAT? $1,695? That’s only $100 lower. I was like, hell no.
But…AA(#@(#$&#($&($#&#(*$…I NEEDED THIS DOMAIN NAME. It’d immediately increase the reputable aspect of it. And if it would get traction on .net, obviously the .com price would be higher after launch.
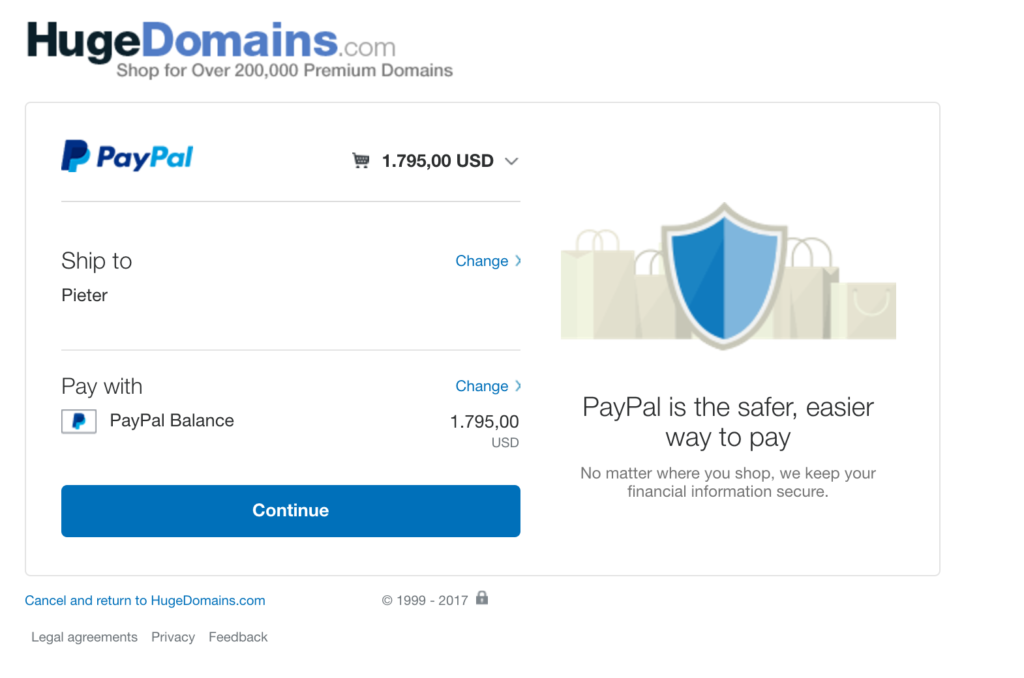
When I launched Nomad List as nomadlist.io in 2014, I had to negotiate down nomadlist.com from $8,000 to $2,000! It took ages and was still a lot of money. So, whatever, I’ll pay. But meanwhile the $1,695 offer had expired. So whatever, I’ll pay $1,795. I could use Nomad List’s revenue to pay for it. It burned though, that’s a shitload of money for something merely digital. If Hoodmaps would make just $2,000 back though, I’d already be proftiable. So I did it:
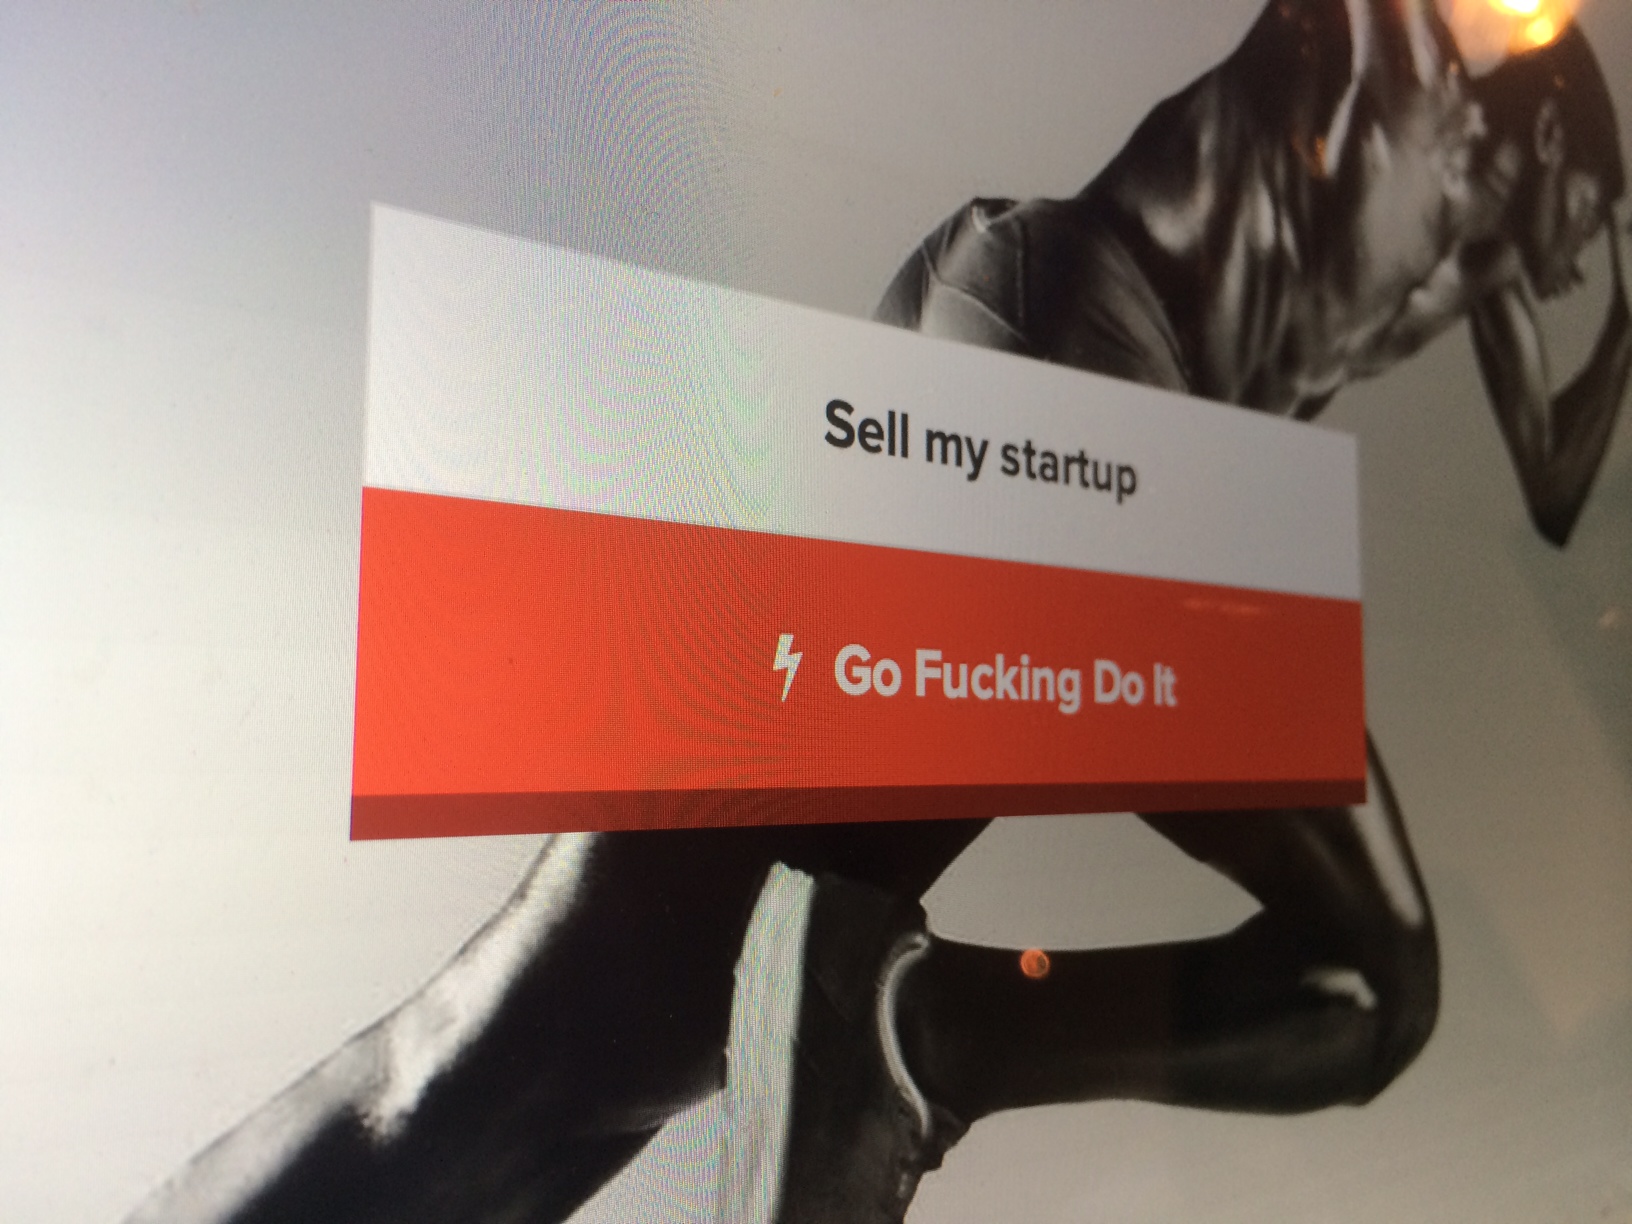
Launch
Now it seemed ready for launch. But where do you start? I wanted to do it properly. The launch is THE most important thing. In some ways, it’s more important than the product. You can have an average product with a great launch and everyone will be talking about it. Most times I see excellent products with mediocre launches that simply die out (which is sad). Obviously, the best is to have a great product coupled with a great launch.
This launch, I’d focus on Product Hunt, Hacker News and Reddit. After showing up there, it’d be hopefully picked up by press (through its viral effect). If not, I’d do my own press outreach.
Very important: EVERY platform has its own type of language and vibe. This means adapting your style of posting to the platform. I’ll discuss each vibe.
Twitter promo
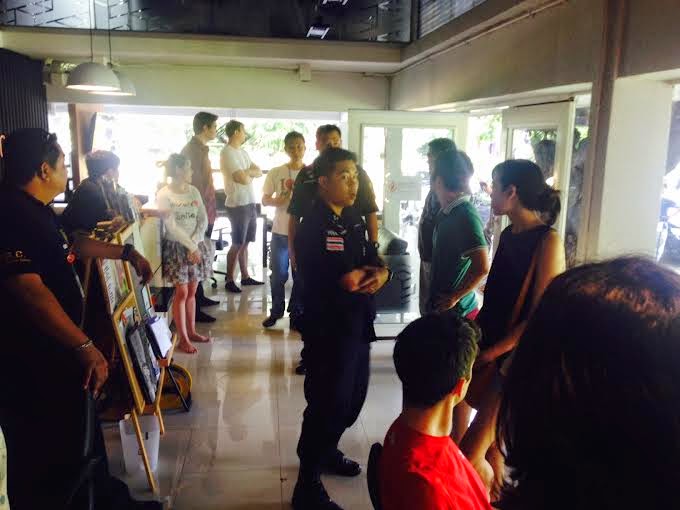
I did one new thing. I went around Los Angeles (where I am now for a month) and tested Hoodmaps in-real-life. I started in Fairfax, went to Hollywood Heights, then Koreatown and then Silver Lake and cross-referenced if the tags and categories were accurate. This was fun to do and gave some proof that it actually worked. And yes some promo:
🔥For the launch I'm live testing t.co/sdIVMcMNjE in 🇺🇸LA today, first spot: Fairfax in West Hollywood 1/478 pic.twitter.com/AFKTTM8bn1
— Pietz @ 🇺🇸 (@levelsio) July 9, 2017
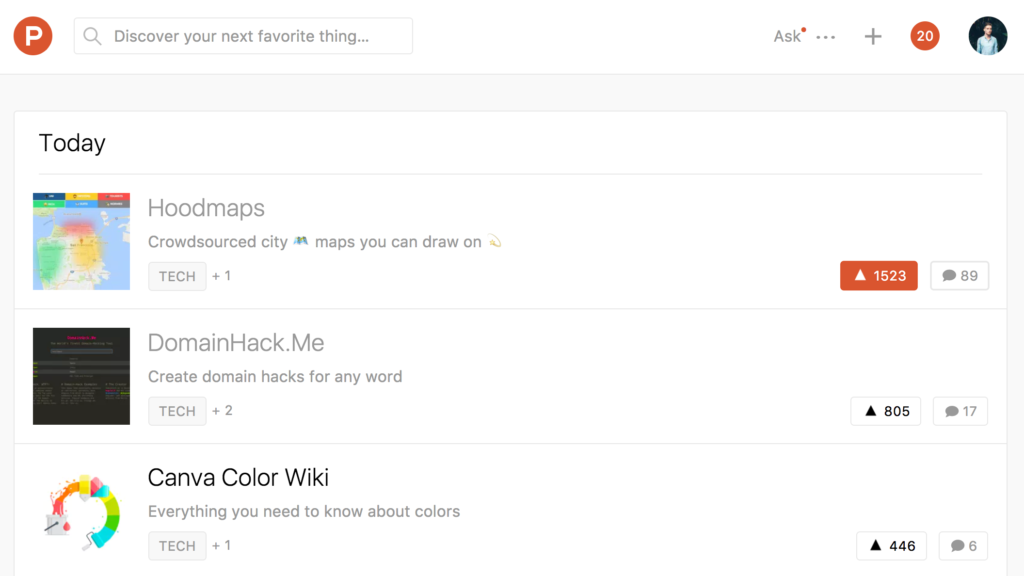
Launch to Product Hunt
Product Hunt’s vibe is happy, positive, a bit marketing-y. So let’s adapt to that.
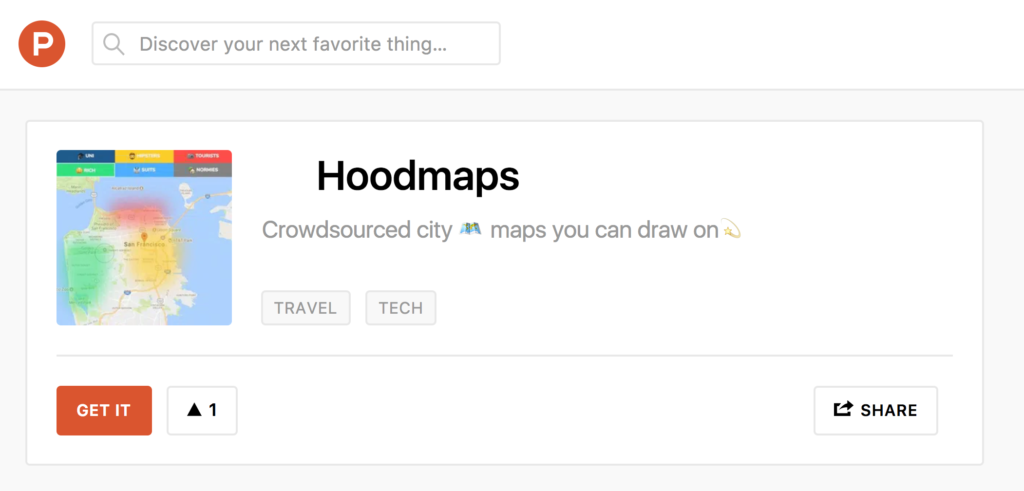
The slogan used emoji’s as they’re cute and increase engagement. There’s strong mental cues for PH’ers here: the process is reading “crowdsourced”, OK, “city maps”, OK how? “you can draw on”, oh cool I wanna try!
I submitted on Sunday at 1 minute past midnight. As that’s the best time to launch. The ranking is then refreshed and you have most odds to reach the top of the charts. Having a good start in the top of Product Hunt’s ranks is half the work, the other half is maintaining it for the next 23 hours. Yes, this means I didn’t sleep for about 36 hours. Sacrifice.
I tweeted it out with a link to Product Hunt (importantly):
💫 My new startup 🗺 Hoodmaps is now LIVE on @producthunt: Crowdsourced 🌇 city maps you can draw on 👉 t.co/0sQ2XdvCfN pic.twitter.com/Zt8ZH3jWPA
— Pietz @ 🇺🇸 (@levelsio) July 9, 2017
I quickly jumped into the comments section to introduce the product, tell its story and immediately answer any questions (and fix bugs) that people commented on.
It worked though. It went to #1 and stayed there for 24 hours.
Launch to Hacker News
Hacker News’ vibe is distinctly sceptical, intellectual and highly allergic to marketing and getting sold to. “These 10 Growth Hack Tips Will Change Your Life” will NEVER work on HN.
Instead of posting on the main board, which I could, I tried Show HN: which is like a showcase board for when you made something on Hacker News. Less competition and more odds to get on top. A highly upvoted Show HN: also has the chance to get to the frontpage.
I kept the slogan modest here, again “crowdsourced” but instead of maps I used “visualization” which is more data-oriented which HN engineers love. No emoji’s. No cute stuff. HN hates cutes stuff. HN kills kittens.
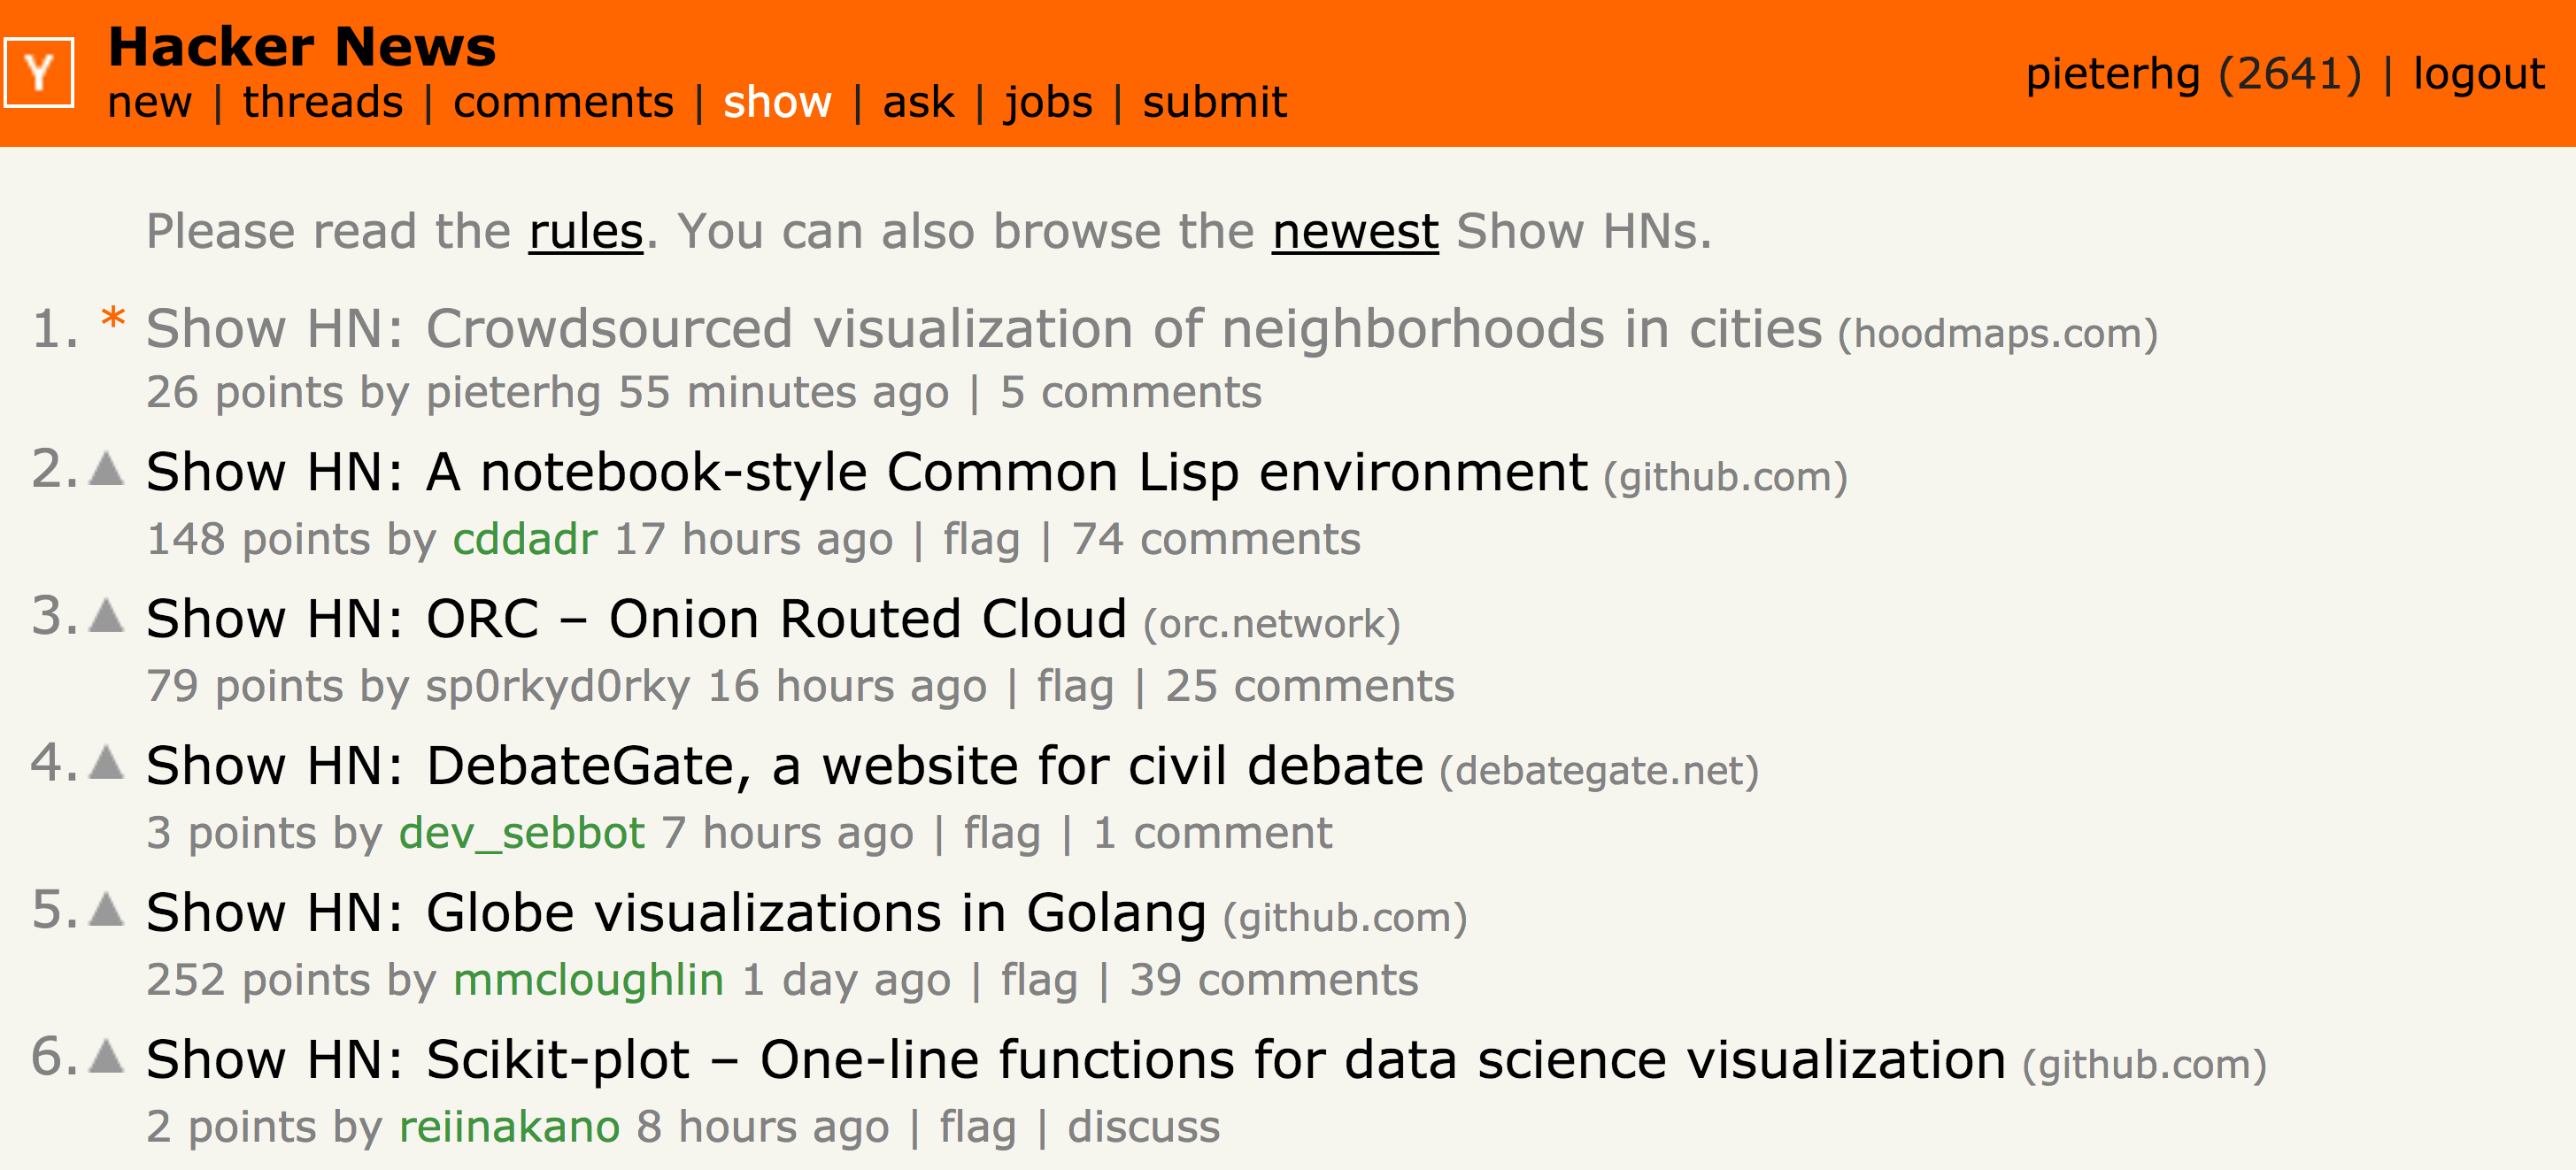
It had good traction on HN and stayed on top of Show HN: for about a day. In post-mortem, maybe I would have posted it to the main board for a bit more traction.
Launch to Reddit
Reddit’s vibe is like Hacker News but more mainstream and thus for any topic. Reddit also hates sales tactics and is highly critical of your product. If what you’re posting has ANY bugs or doesn’t work as expected, it will NOT get upvoted but instead get DESTROYED in the comments section. Reddit is a spoiled child, it gets the best content on the web, and it’s all competing for the frontpage.
Launching to Reddit is notoriously hard. It. Has. To. Be. Perfect.
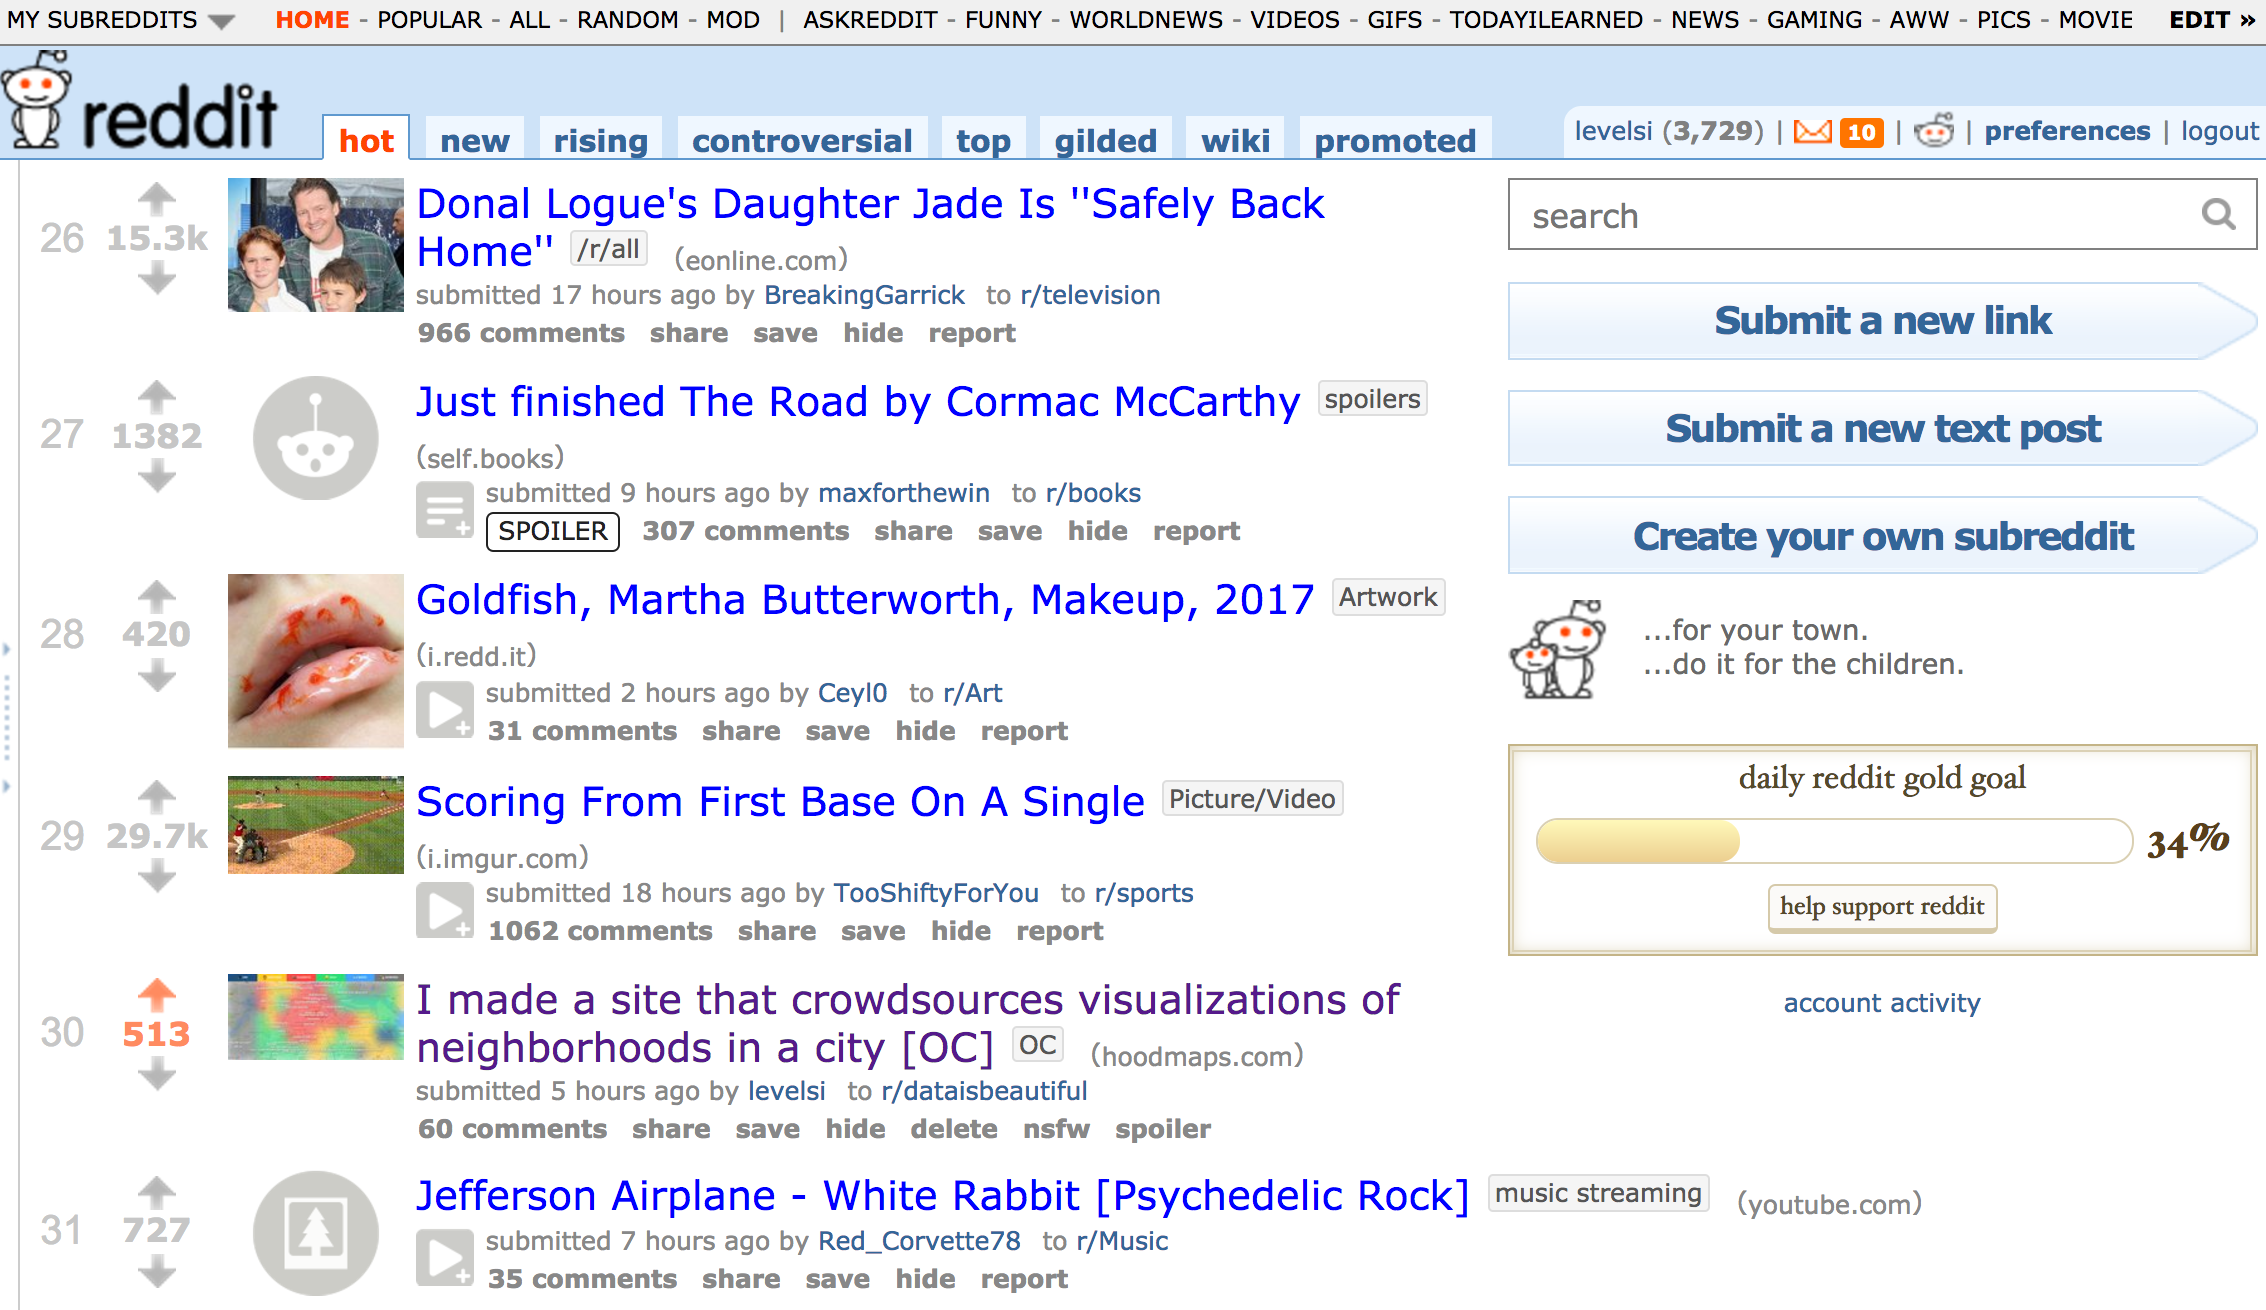
Obviously, the goal was to get to the frontpage. But I never expected that would actually happen. I had it happen ONCE before submitting Nomad List to /r/dataisbeautiful: 2 years ago on /r/dataisbeautiful. The comments were quite critical but it reached the frontpage. With previous success, and Hoodmaps also being a relevant site for the subrreddit /r/dataisbeautiful since it’s also data based (and beautiful), I submitted it. I needed to be SPOT ON with the title here or it’d die.
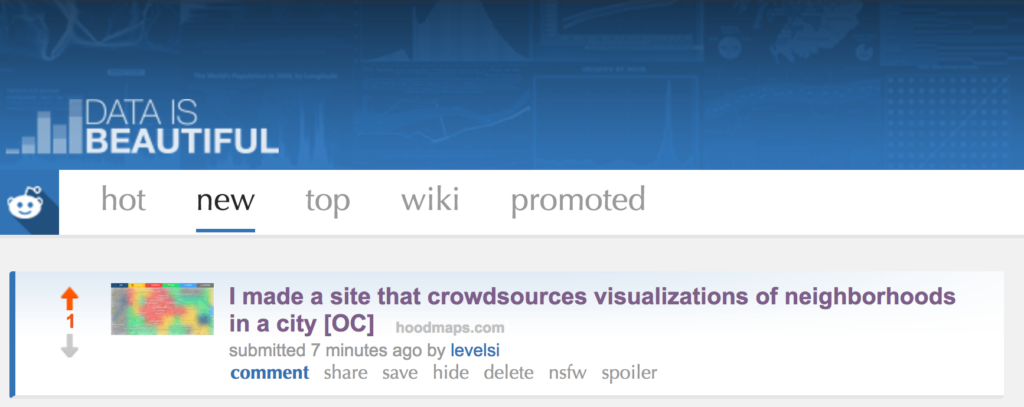
“I made it” made it personal and “crowdsourced visualizations” worked with the data-oriented subreddit. It was descriptive, humble and simple.
Like with Product Hunt, I jumped straight into the comments and following the guidelines of the /r/dataisbeautiful subreddit, I explained the source of the data, the process and how I built it. This took considerable effort and probably helped a lot. Again, NO SALES-y shit:
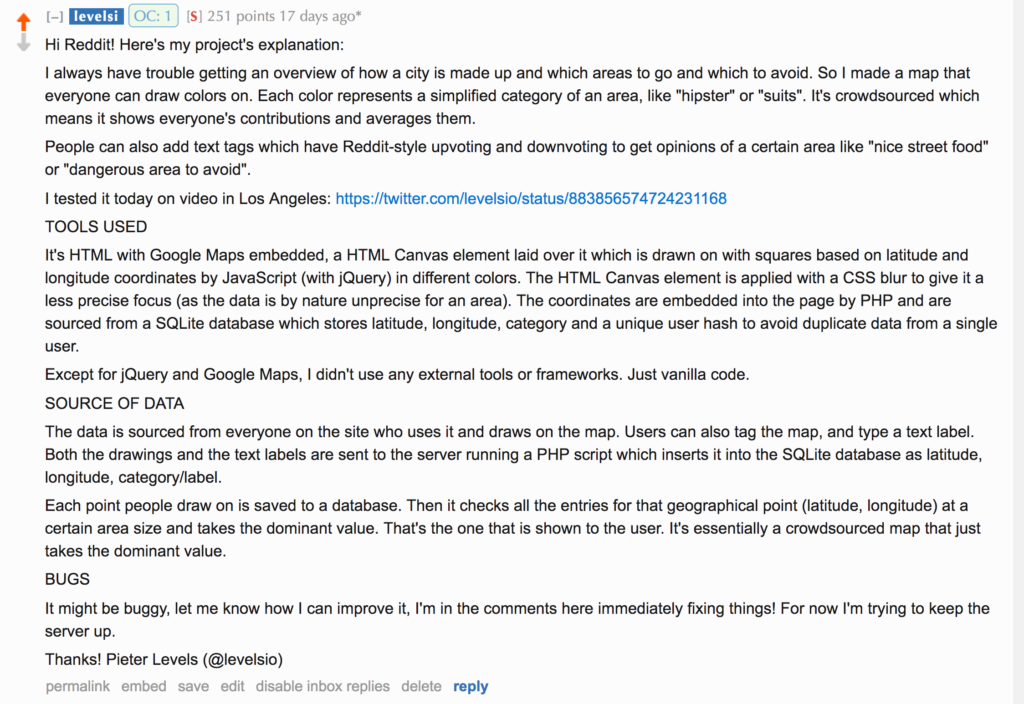
It worked, it went straight to #1 and the comments were 90% positive this time:
Server crashed
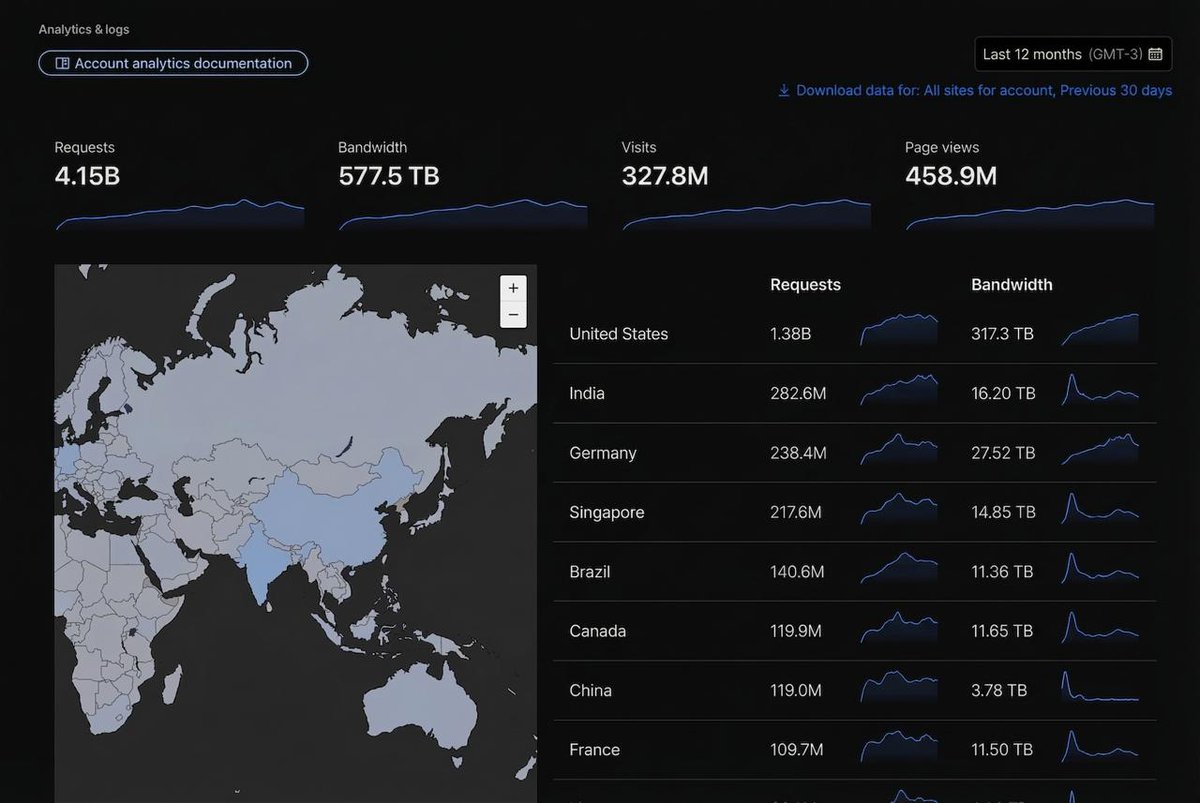
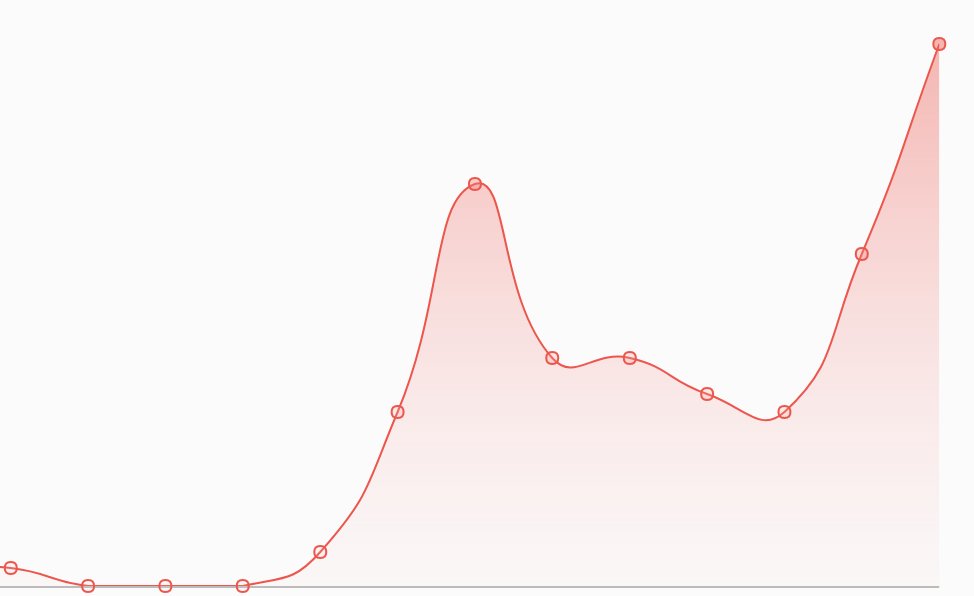
Where Hacker News is the #3069 most popular website in the world and Product Hunt is #4271, Reddit is the #23 website in the entire world:
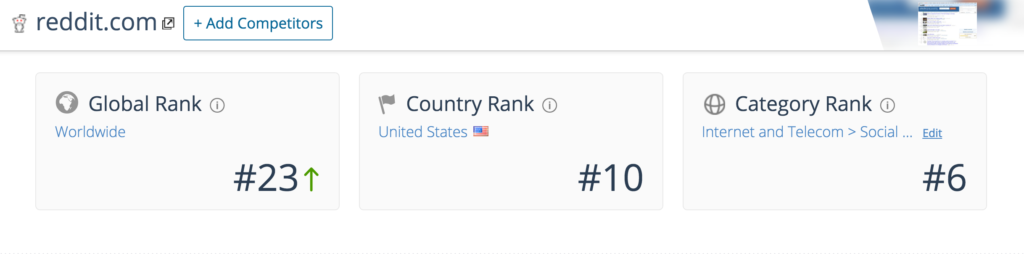
This means, if you get traction on Reddit, kiss your server goodbye.
Do you know the secret to getting to Reddit’s frontpage? Keeping your server up. 99% of sites can’t keep their server up when Reddit floods them. Redditors know this because they’ll see a site on top of a subreddit and then nothing happens when they click the link. They’ll just skip it (they’re used to sites crashing cause of the “Reddit effect”), and won’t upvote it. That means if you can’t keep your server up, it will simply stop rising to the top and die out. That’s literally why most sites (even if they’re great) don’t get on the frontpage.
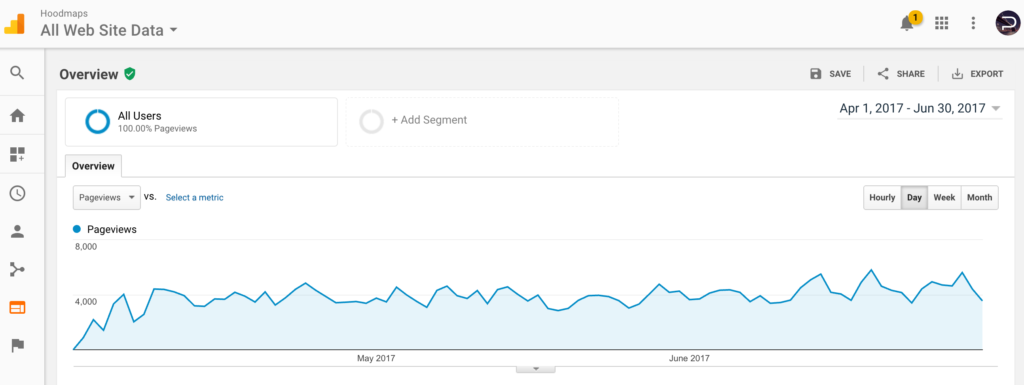
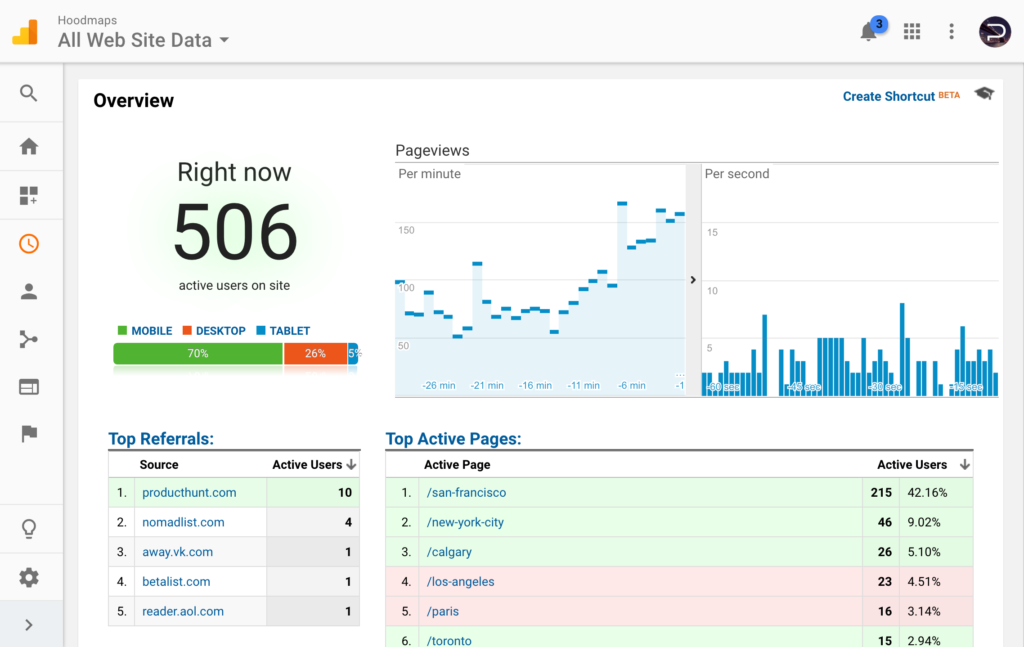
You can see it in Google Analytics during a launch. You’ll see the real-time amount of people on your site get stuck to the number where your site will stop responding. That means unless you fix something that makes your site responsive again, you won’t raise that number.
I now had 500 people drawing on Hoodmaps per second and sending it to the server. PHP couldn’t take it. My inferior code couldn’t take it. The site stopped responding. And upvotes stopped.
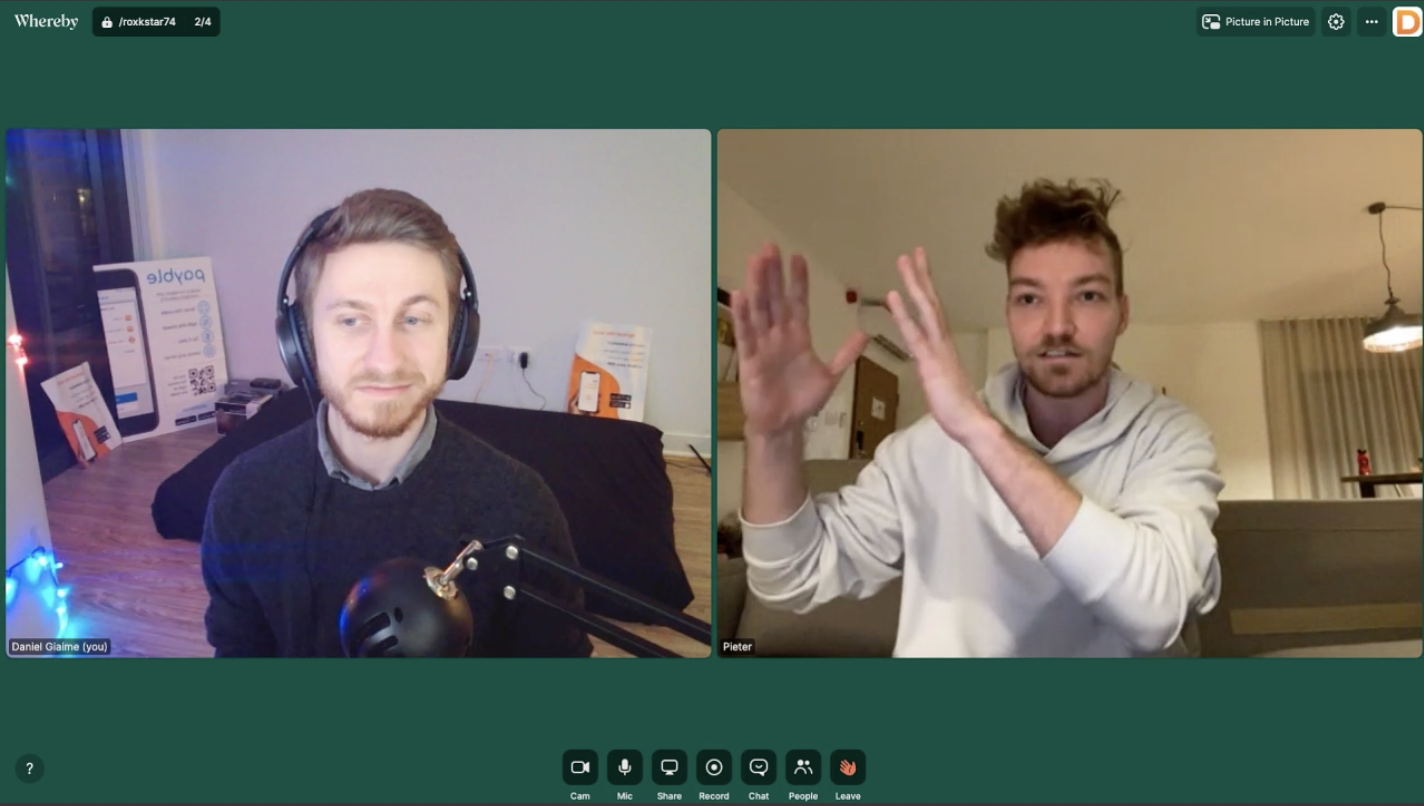
I messaged my server guy Daniel Lockyer to stand by and help where he could. It’s always better to have someone else on the server because when Reddit floods your server you need ALL hands on deck and quickly iterate and test quick fixes to keep it up. You only have a short window of literally minutes to fix this stuff. If your site is gone for 15 minutes, it’ll probably have lost its ranking and is gone again.
Switch to static
The quickest, easiest, fastest way to fix scaling issues in launch is making your site static. What that means is simply not loading your server-side (PHP, JS, whatever) app to generate a page every time a user comes in. Instead, you just show them a static not-dynamic HTML file. This is what you do:
php ./app/index.php > ./app/index.html
In our case, we had to do this for EVERY city on Hoodmaps so I wrote a script for it quickly:
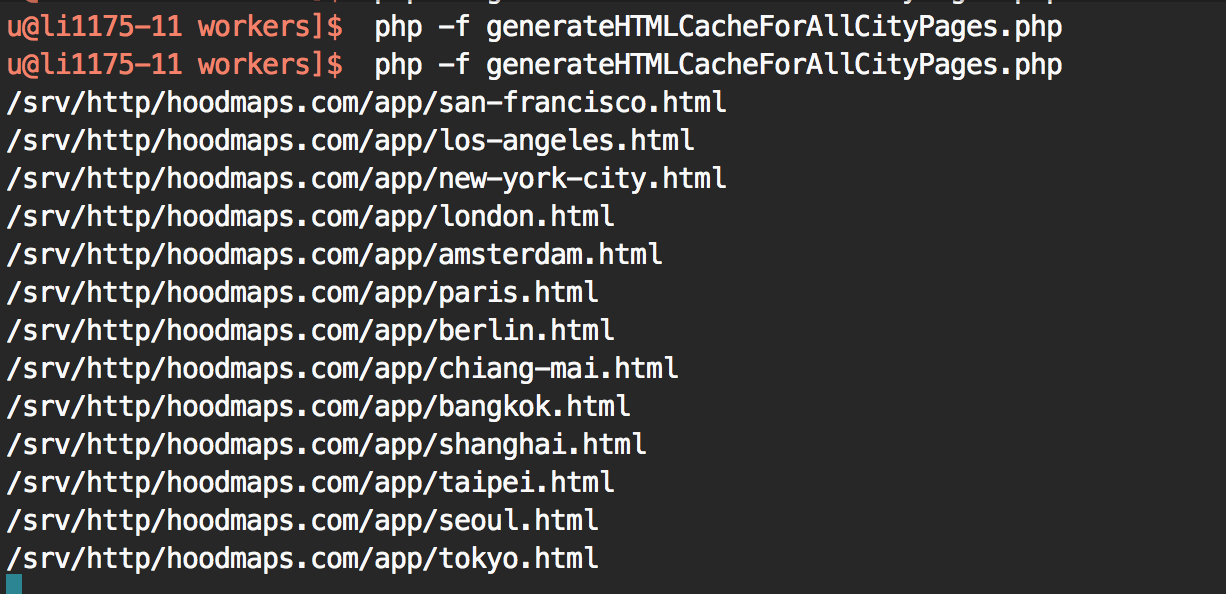
We now had 1,000 HTML files and changed the server config (NGINX) to load the HTML instead of the PHP. This has severe limitations because your content can’t be dynamic anymore. In my case, whatever people would draw on the maps now would be saved but not shown up on the city page as the page was static. But who cares. You can temporarily decrease functionality if it means keeping the page up!
Making city pages static wasn’t enough. The bottleneck that was killing the server was now the AJAX requests of drawing and tagging maps of 500 people at the same time. I went into the JS code and simply commented out any AJAX request to offload the server and disabled the PHP server-side code to not accept any requests either anymore.
Went fully static now, AJAX requests disabled, all writes disabled, to keep server up for awhile: t.co/DucBk1aERS pic.twitter.com/bfyG5I1D4q
— Pietz @ 🇺🇸 (@levelsio) July 9, 2017
That worked! Site is up again
That worked. We knew it worked because suddenly in Google Analytics we saw the real-time users rise:
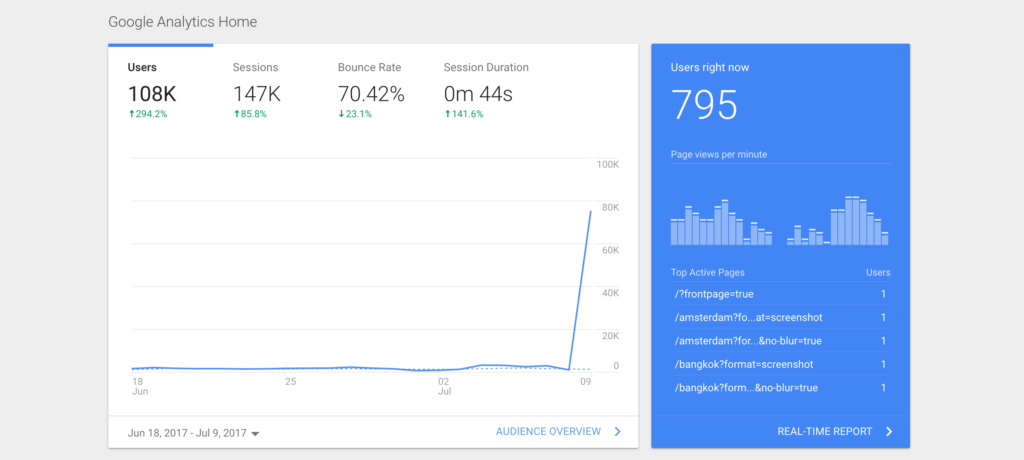
We now had almost 795 people on the site. That’s a lot. Now static, the site was highly responsive. We now got closer, from page 3 to the top of page 2:
We were SO close. I was already happy with how far we got. It got silent in the chat between Daniel (my server guy) and me. We were both simply fixated on refreshing Reddit’s frontpage.
FRONTPAGE!!!
And then suddenly…we were on Reddit’s frontpage!
We did it. I was happy. Now I could finally shut my laptop and go to sleep.
Google shuts me down in the middle of launch
But I couldn’t sleep. Because the it just got bad again. Suddenly I got reports the map wasn’t loading anymore:
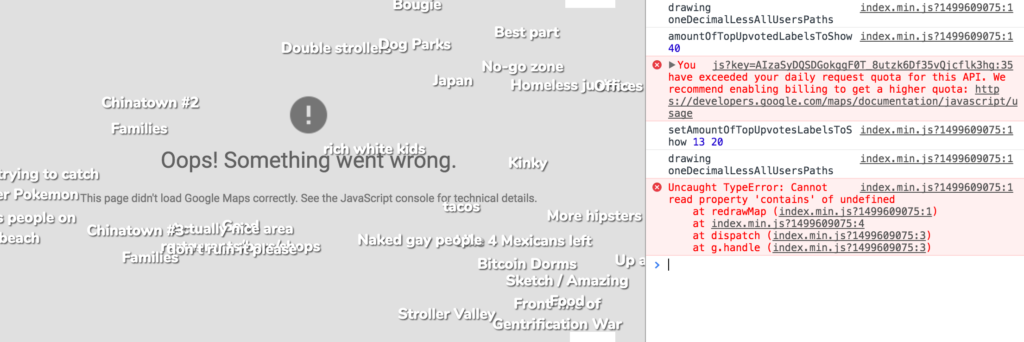
I ran out of my quota. Google Maps works with API keys and if you pass 100,000 loads (I think in a month), they shut you down. Simple as that. I was forwarded to their contact page:
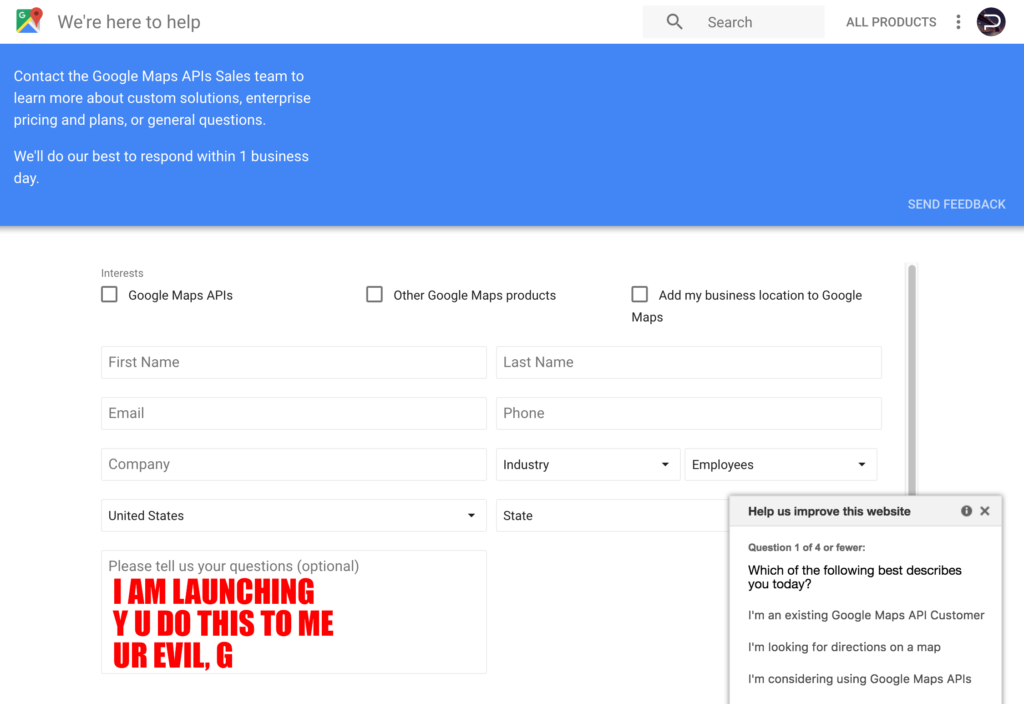
I’d have to wait 3 to 5 working days to get a response to be able to pay them $10,000 to unlock the quota. That’s a terrible thing to do as a business to a potential customer who is in the middle of launching their product!
I made a new API key with my personal account and it worked again for now. I now really went to sleep.
Switch to Mapbox
Switch to @Mapbox ✌🏻
— Burak Aslan (@deadlocked_d) July 10, 2017
The next day I woke up and again for the last 2 hours, the map was out of quota and people couldn’t use it. Twitter people told me I should use Mapbox. They’d be more flexible with quotas and would let the map up at least. It took 2 hours to change all the JavaScript code. I didn’t want to use frameworks for it. So I just rewrote the code. Annoying stuff like Google using (latitude,longitude) and Mapbox using (longitude,latitude), but in the end it worked!
Even cooler, Mapbox has a 3d function which is literally 1 line to enable.
More importantly than fancy 3d though, this time the map stayed up!
4chan
Of course, any site you make where anyone can post anonymously, 4chan loves:
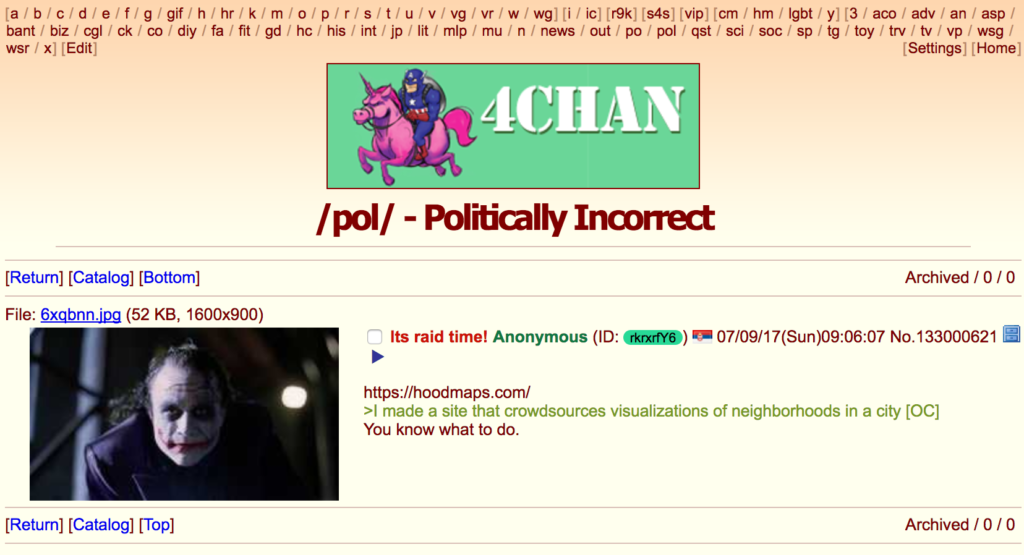
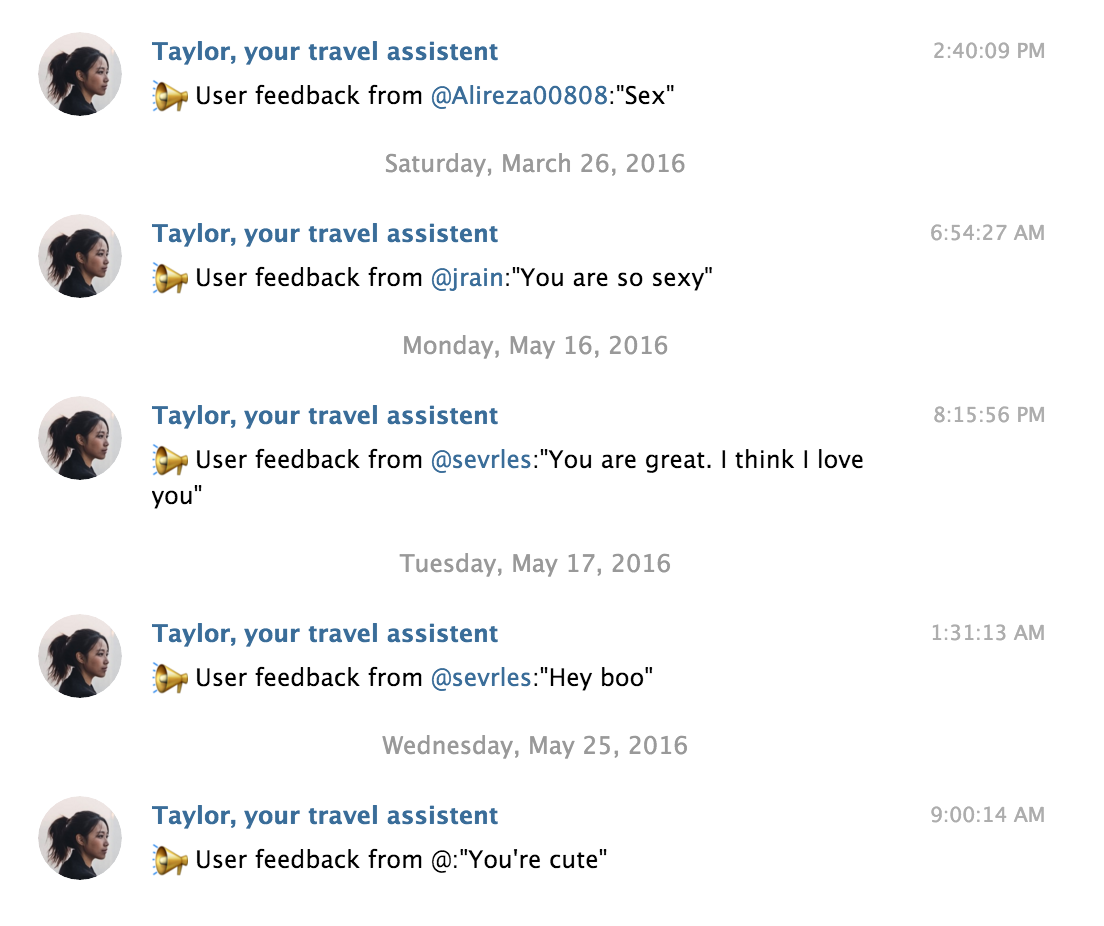
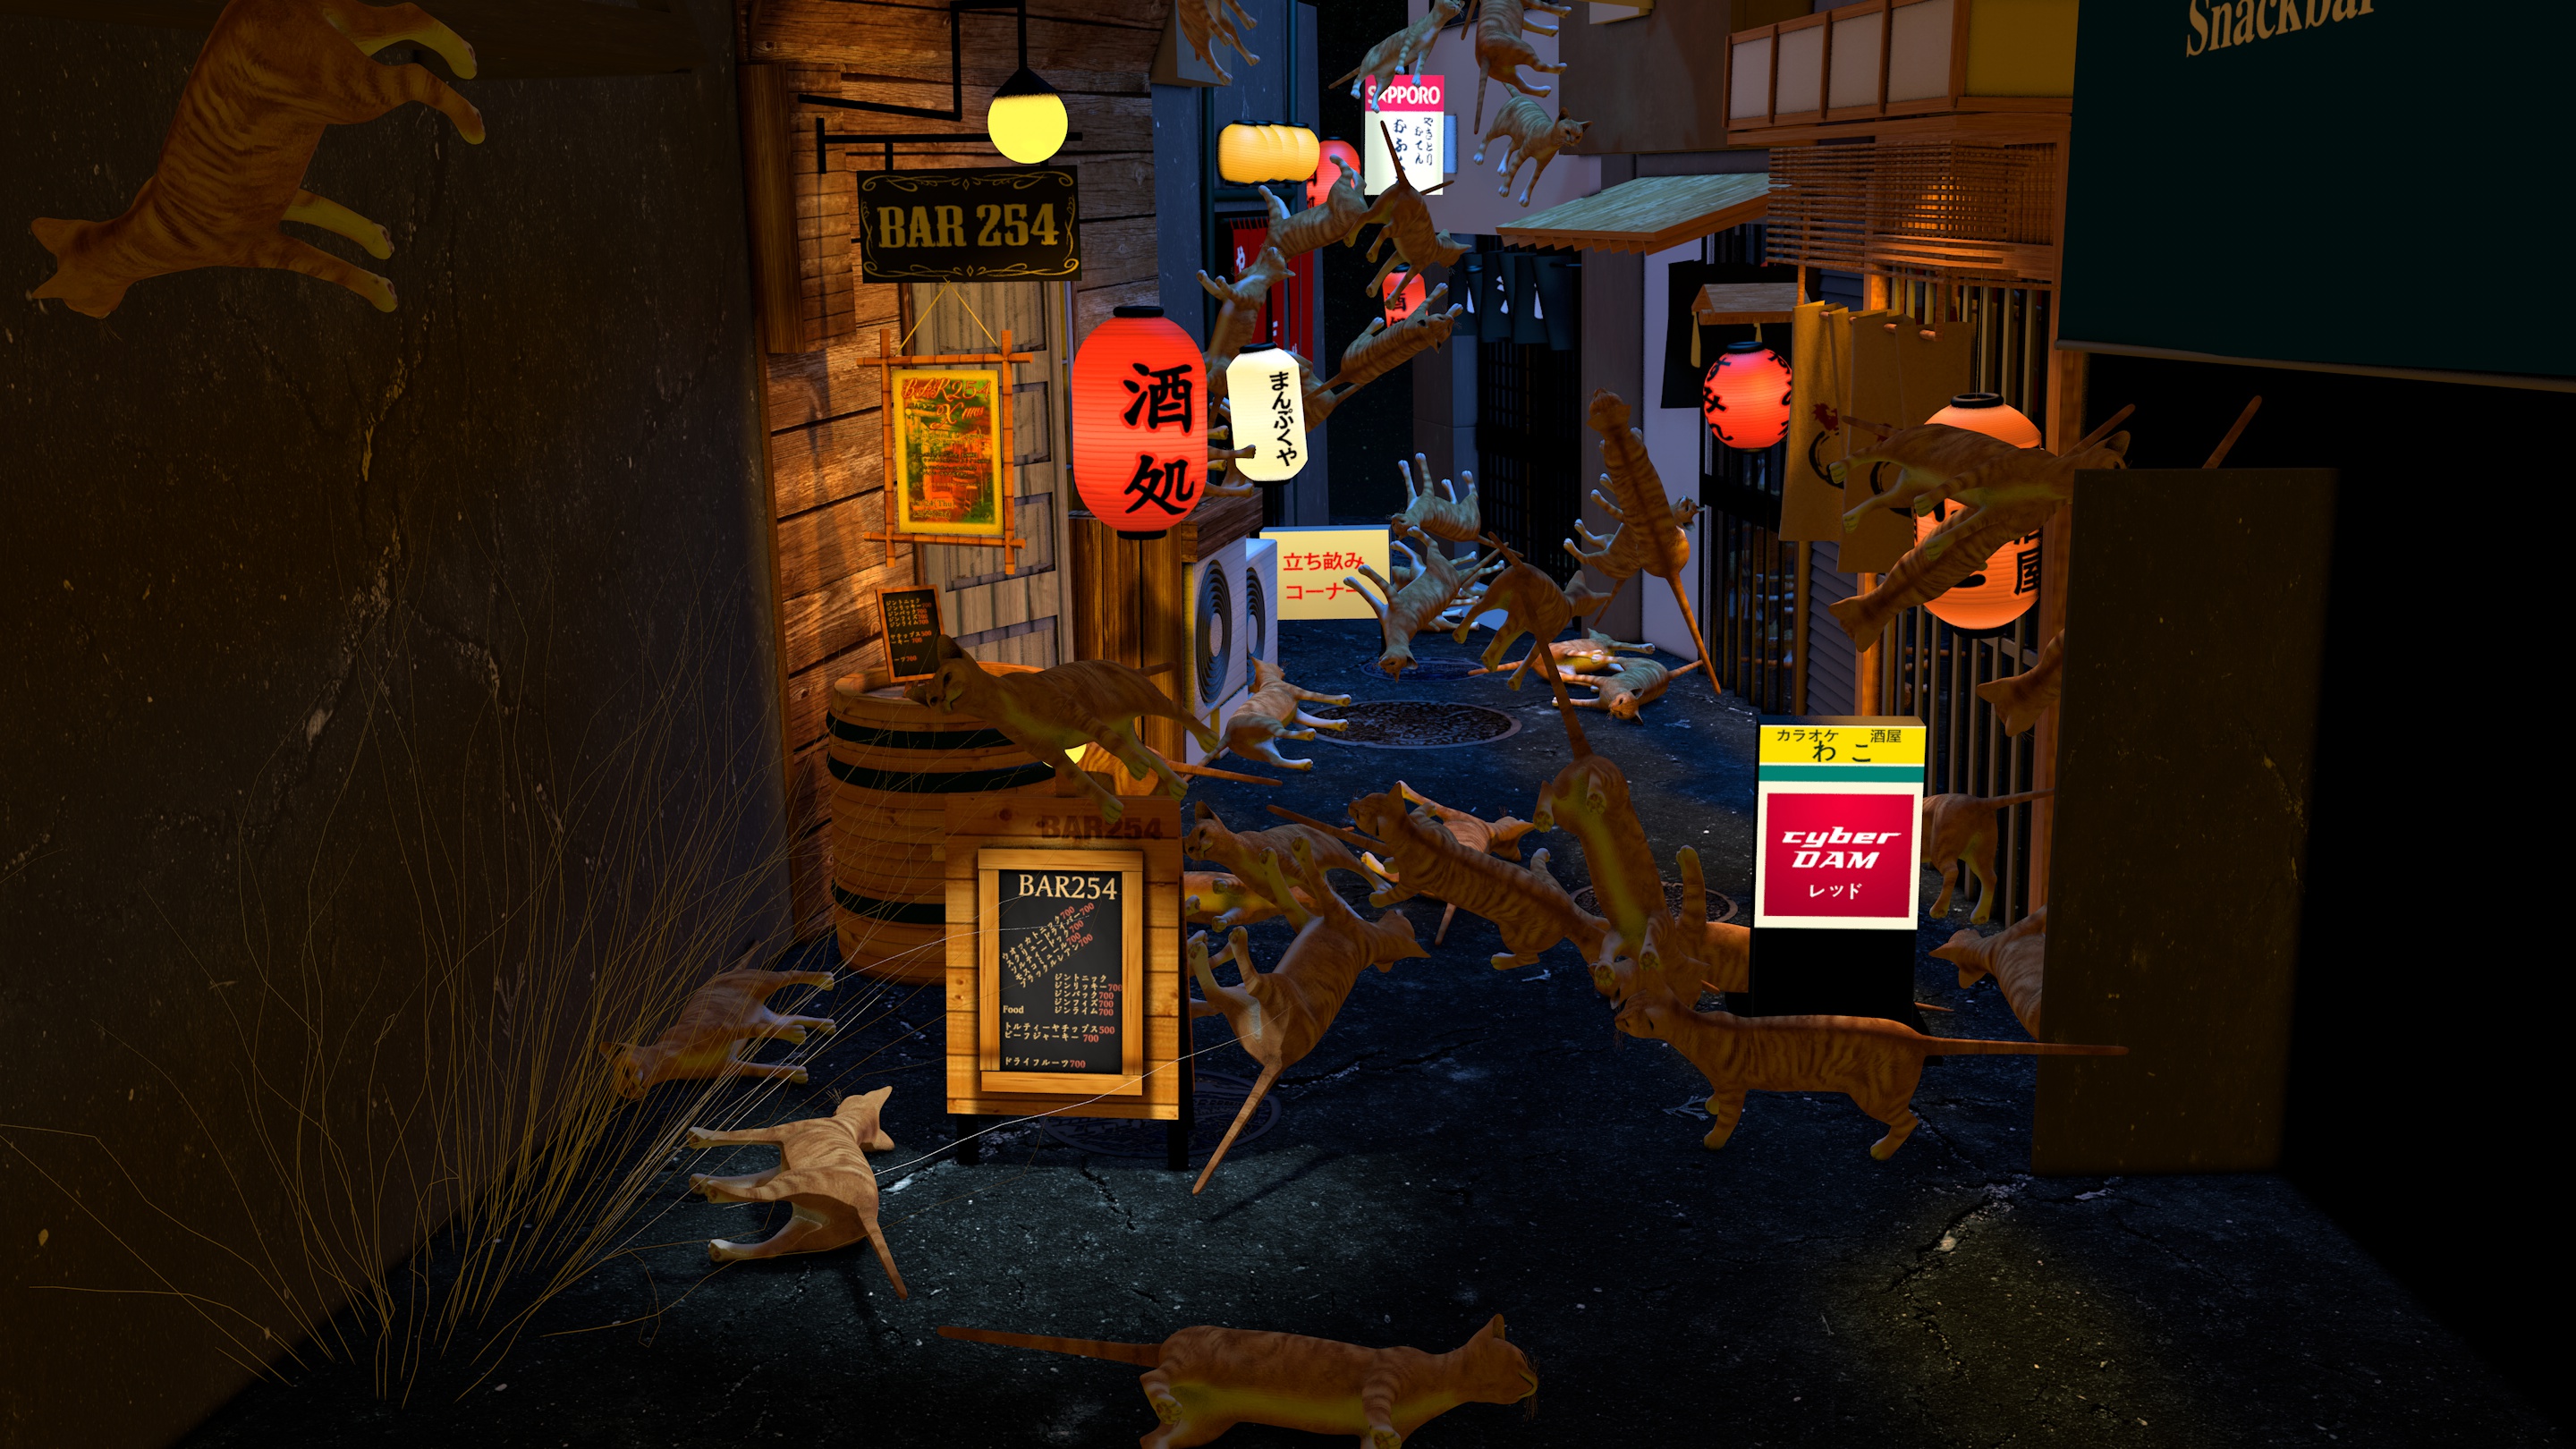
Luckily, my spam filters worked. But some racist stuff showed up. So I added this word list which instantly banned people who used them:
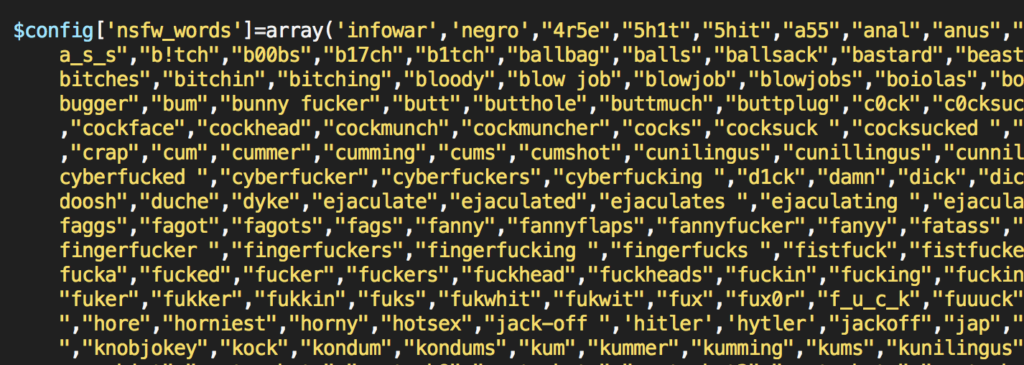
If you write racist stuff on t.co/WFo1SUwkzU, it's replaced by 🐱 Kittens and you're made to watch a video that brings you euphoria pic.twitter.com/ZQa0lGorHy
— Pietz @ 🇺🇸 (@levelsio) July 19, 2017
☺️ Post-launch
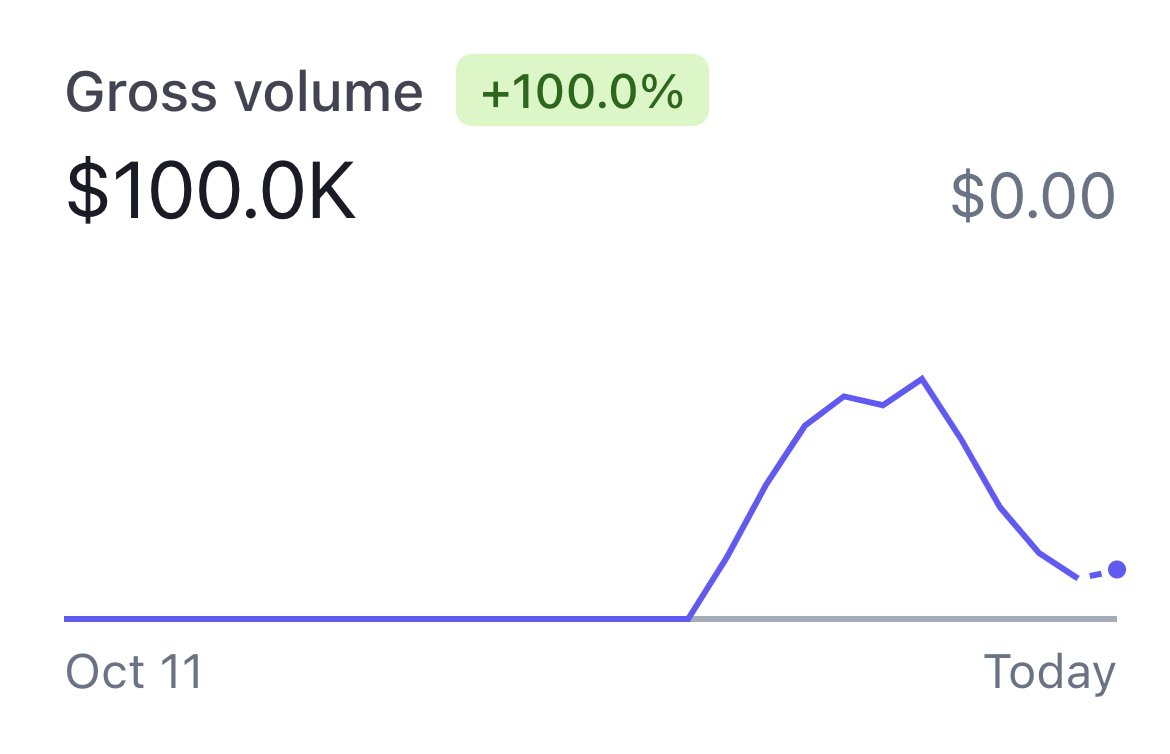
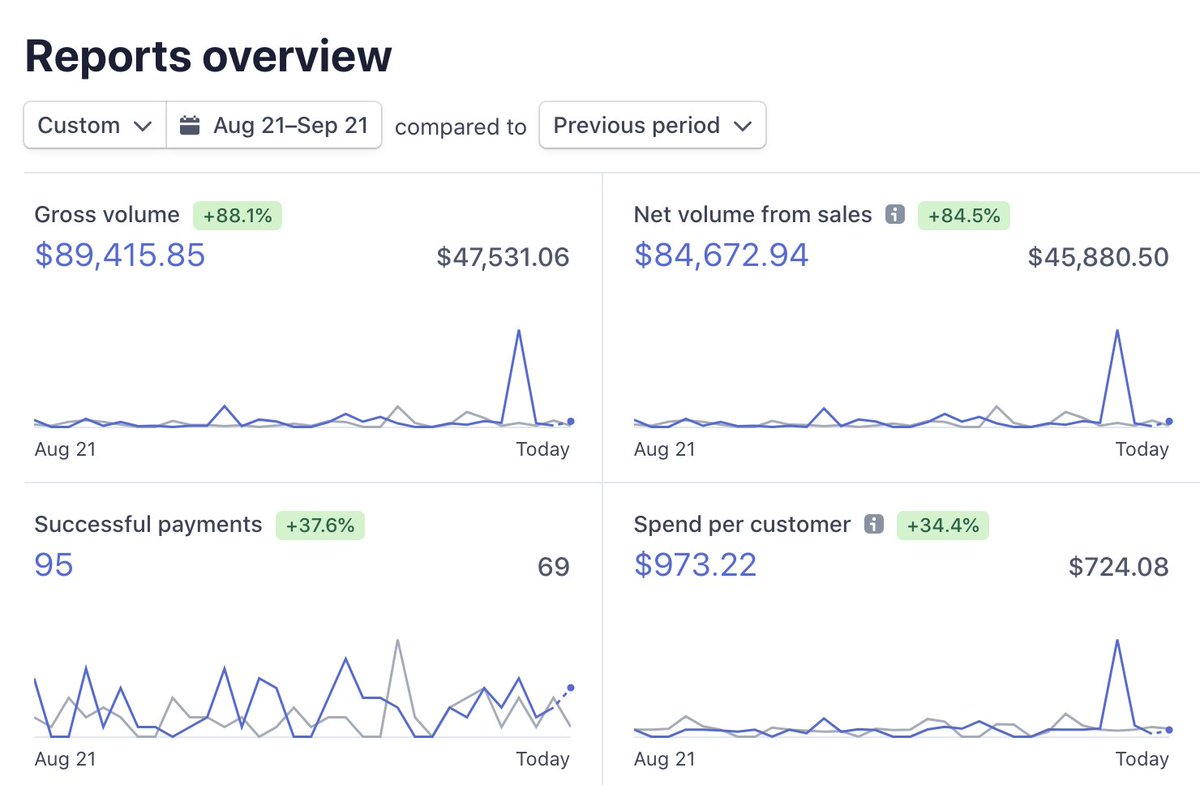
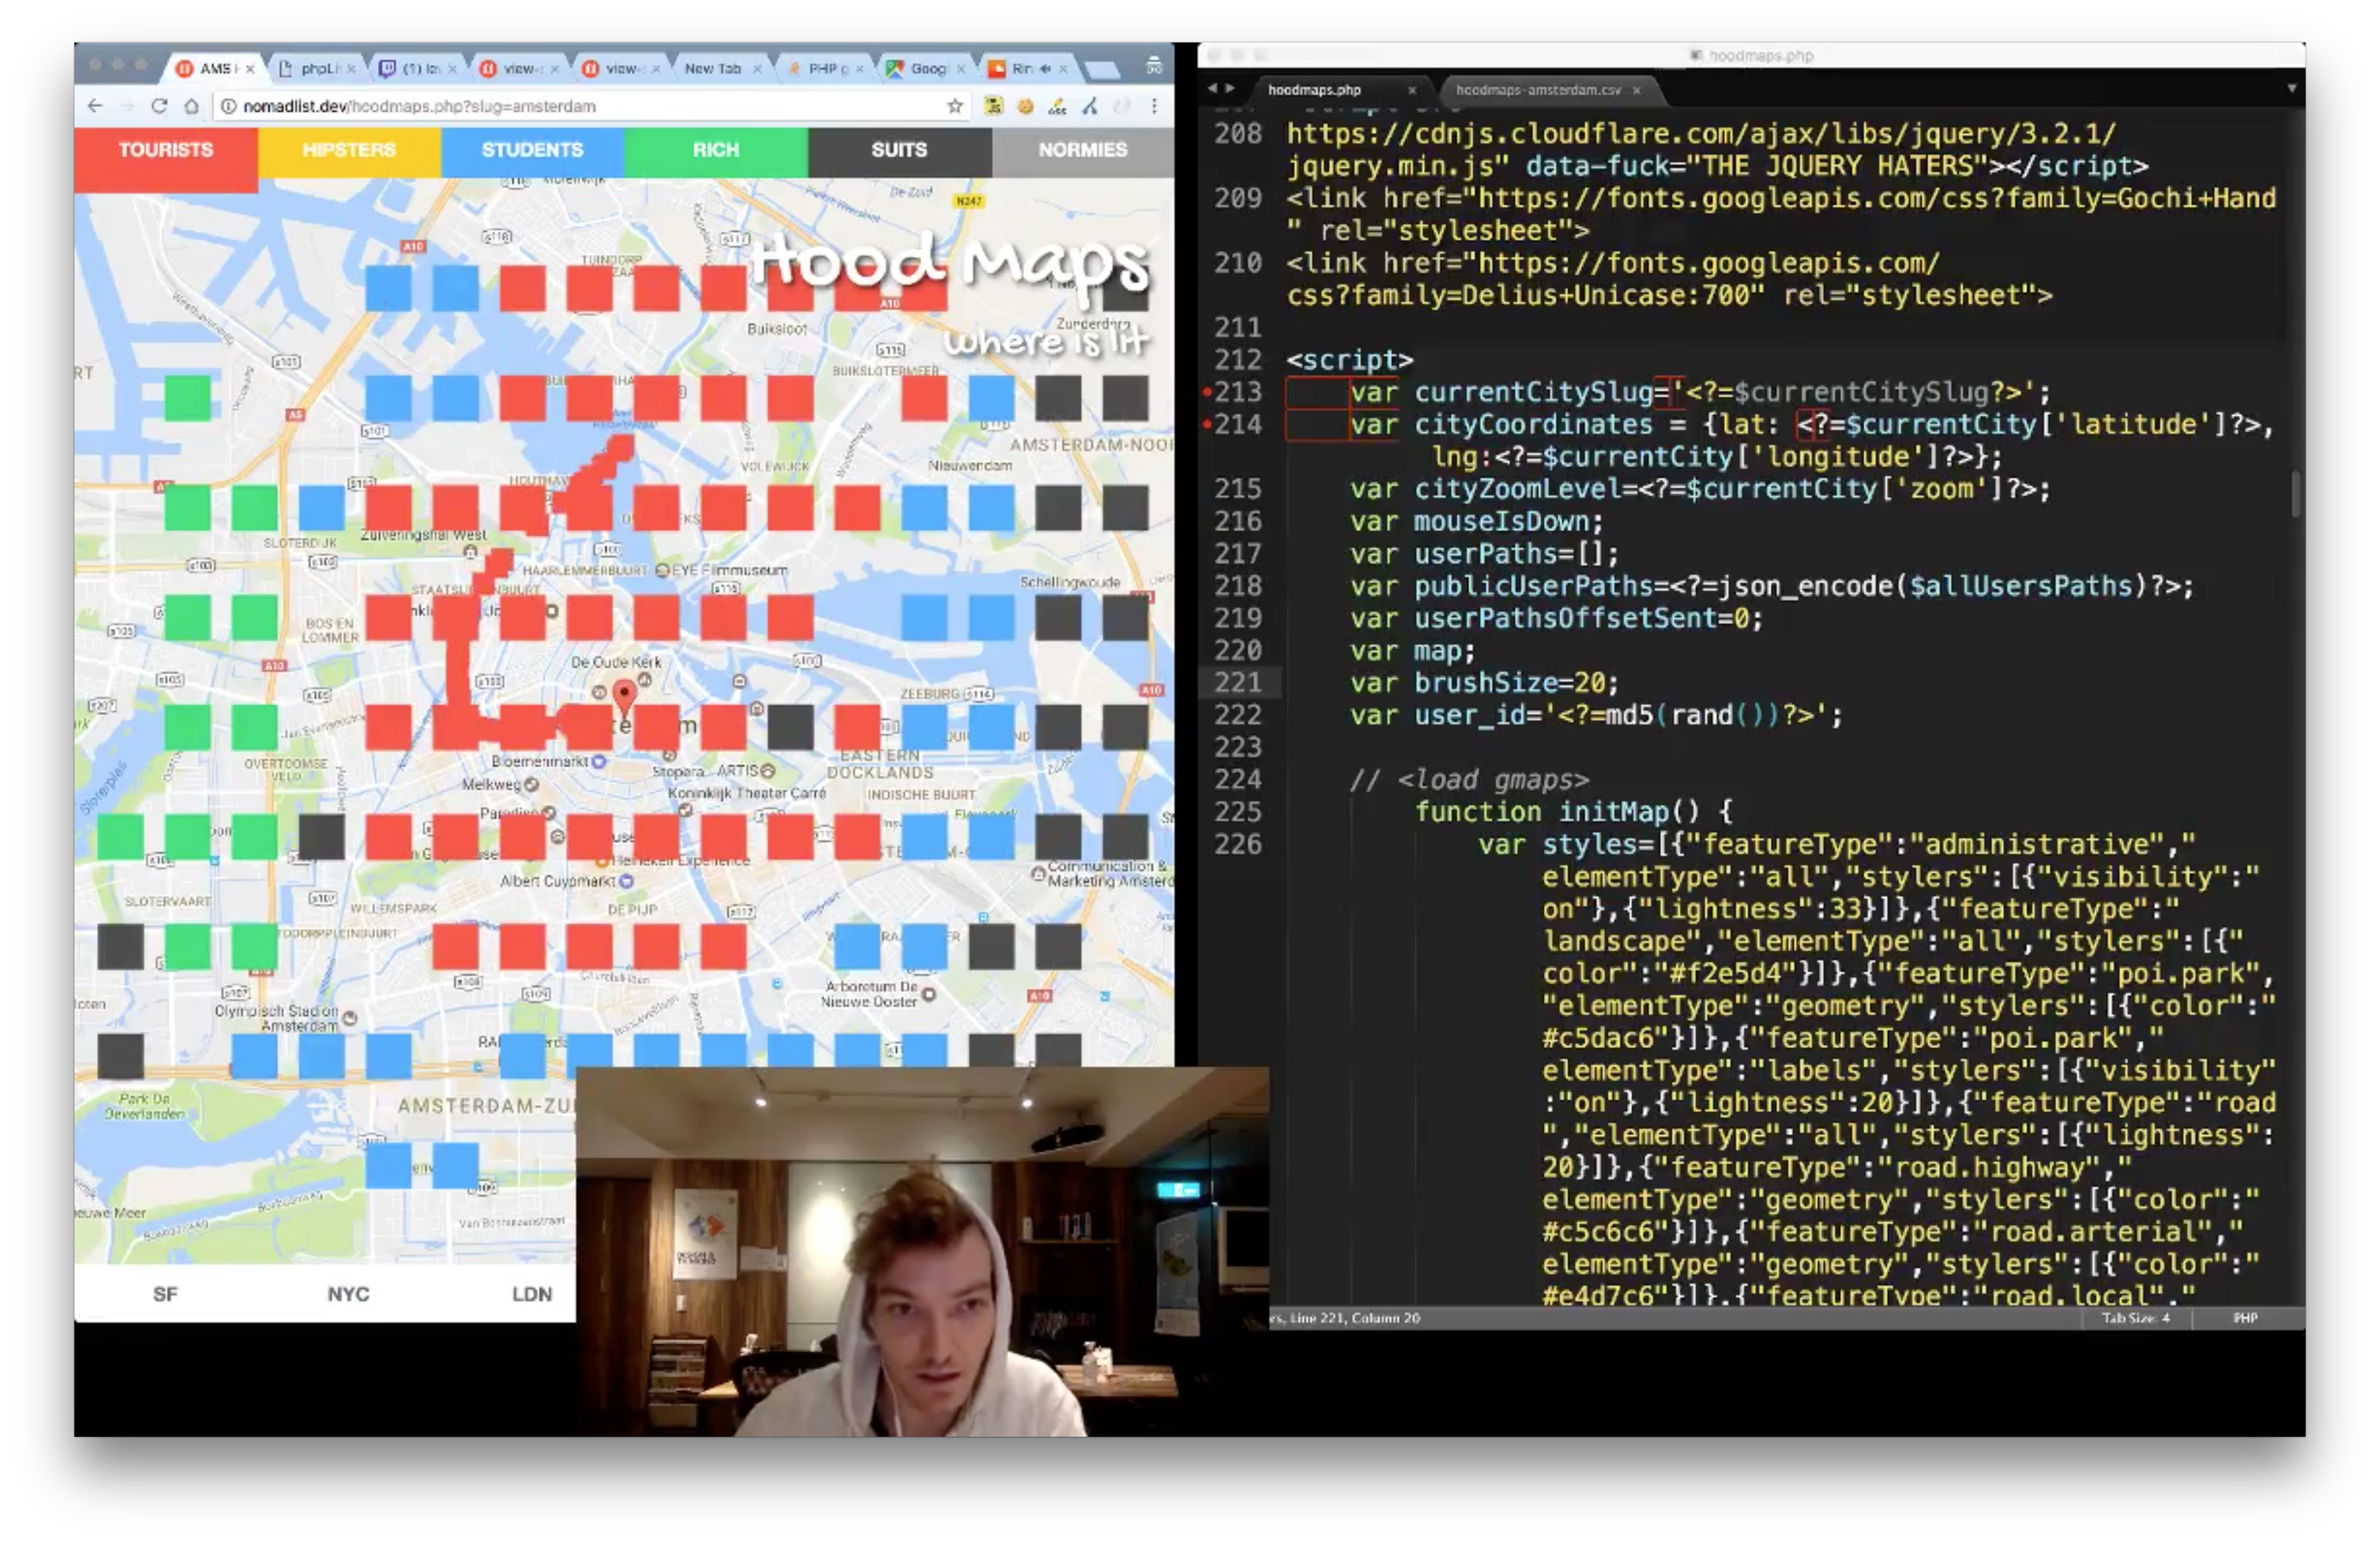
It was literally the best product launch day I’ve ever had in terms of success and traffic. It was bigger than Nomad List’s launch in 2014 because this launch was in sync all within 24 hours:
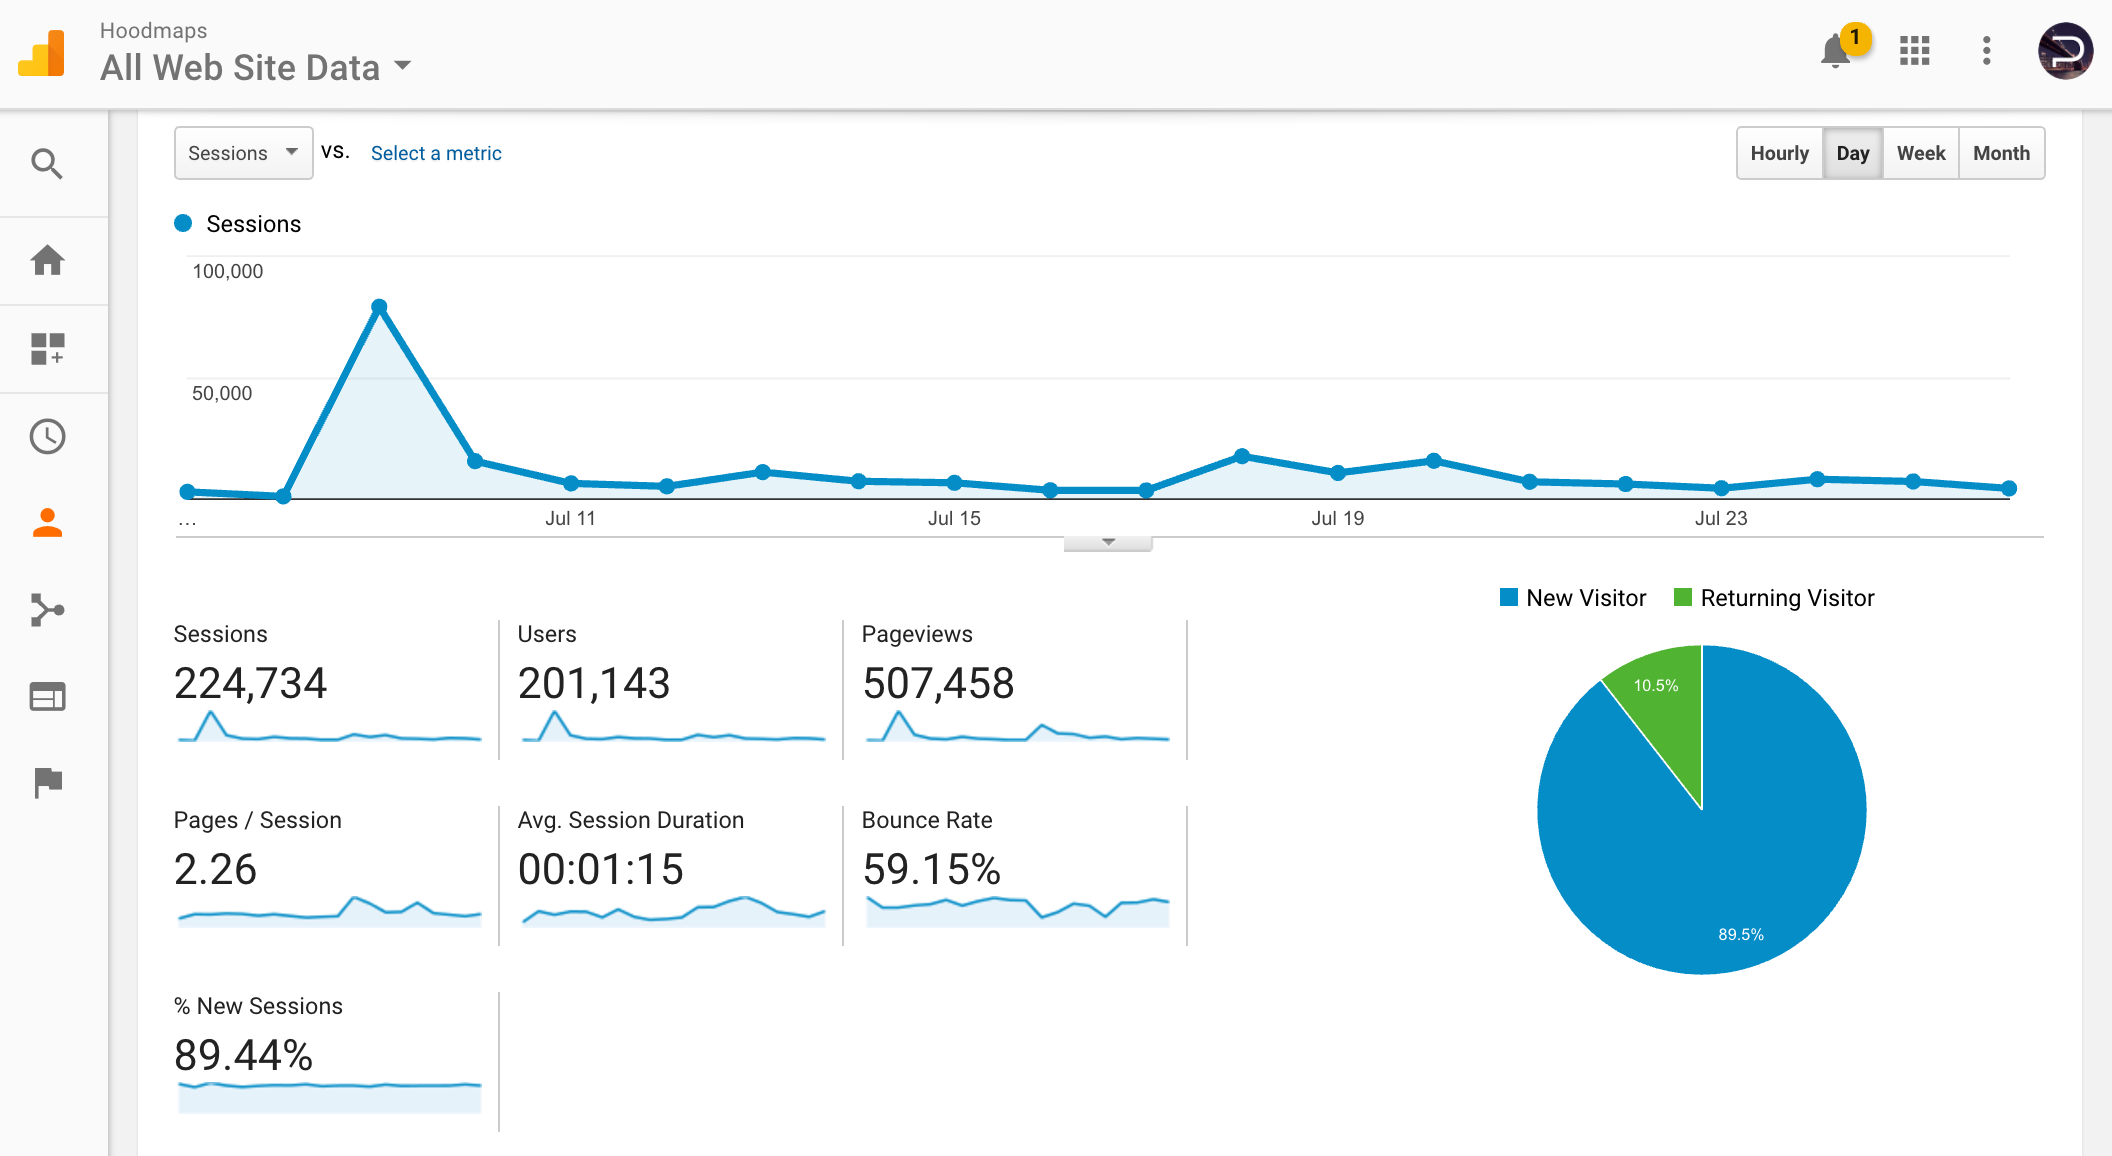
Over 200,000 people used Hoodmaps half a million times.
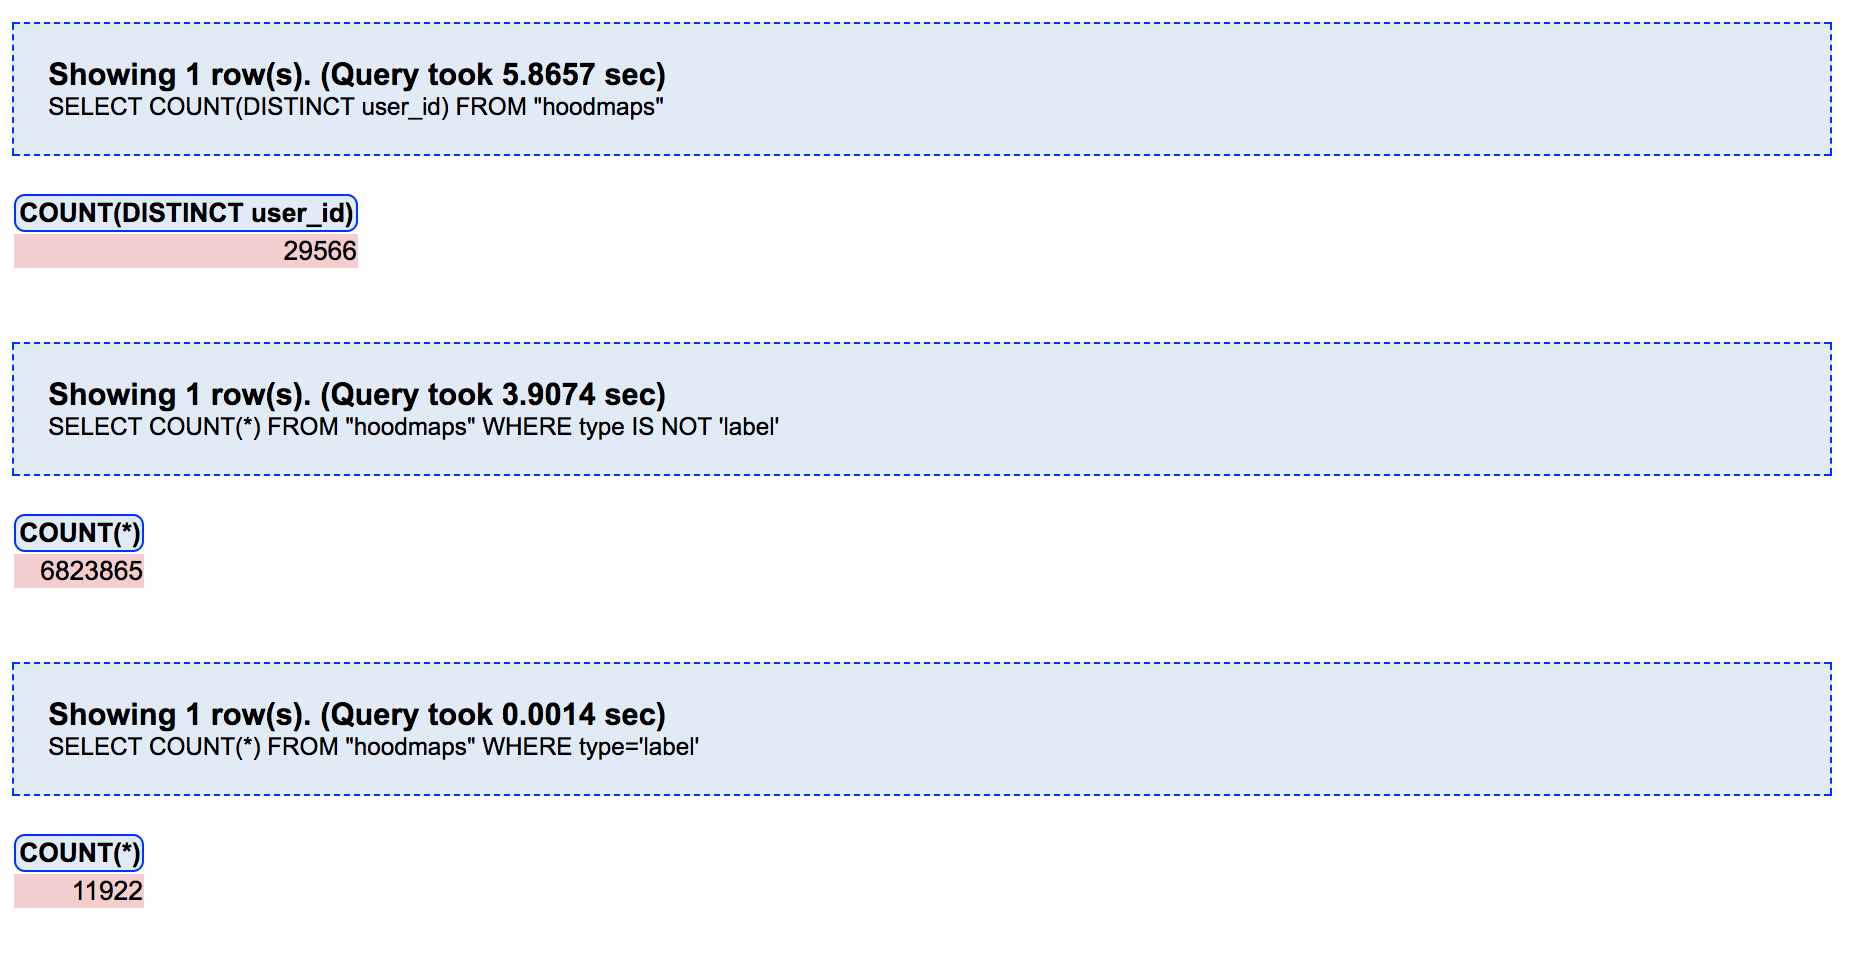
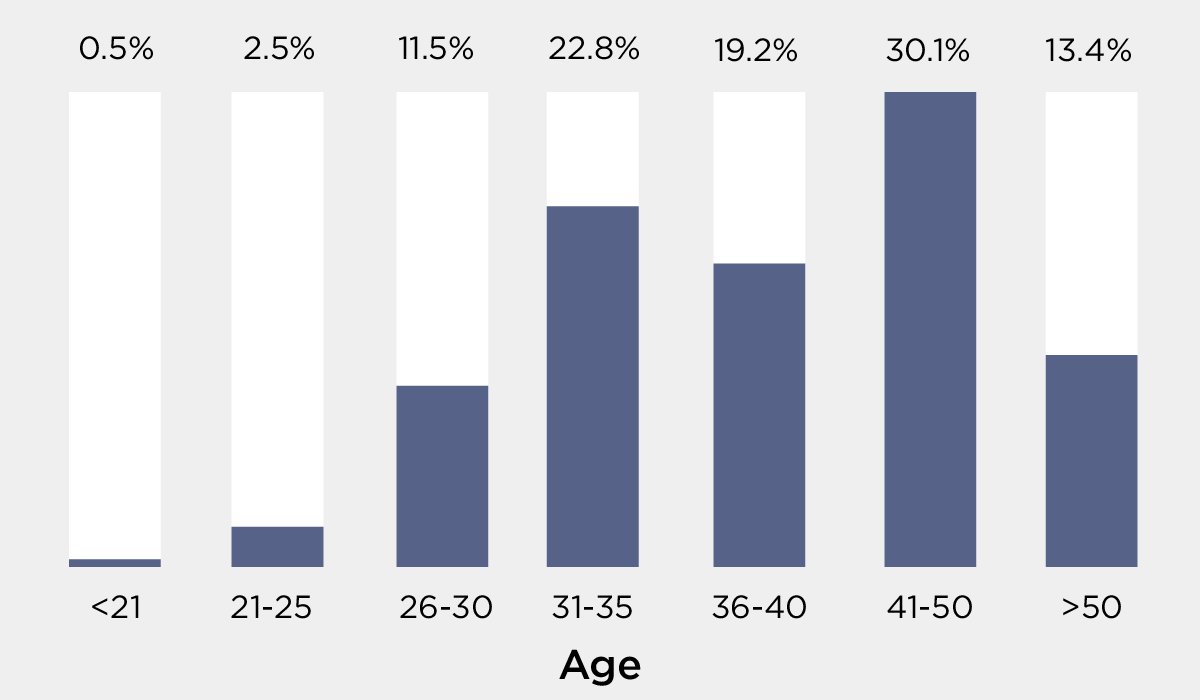
Of those 200,000 people, about 29,566 (or 7%) actually interacted and drew on the map. These people colored 6,823,865 points or about 230 points per user on the map. More importantly, they tagged 11,922 text labels on the map: from “Koreans that think they’re still in Korea” in Los Angeles to “Drink wine along the Seine” in Paris to “Gordon Gekko wannabes” in Manhattan.
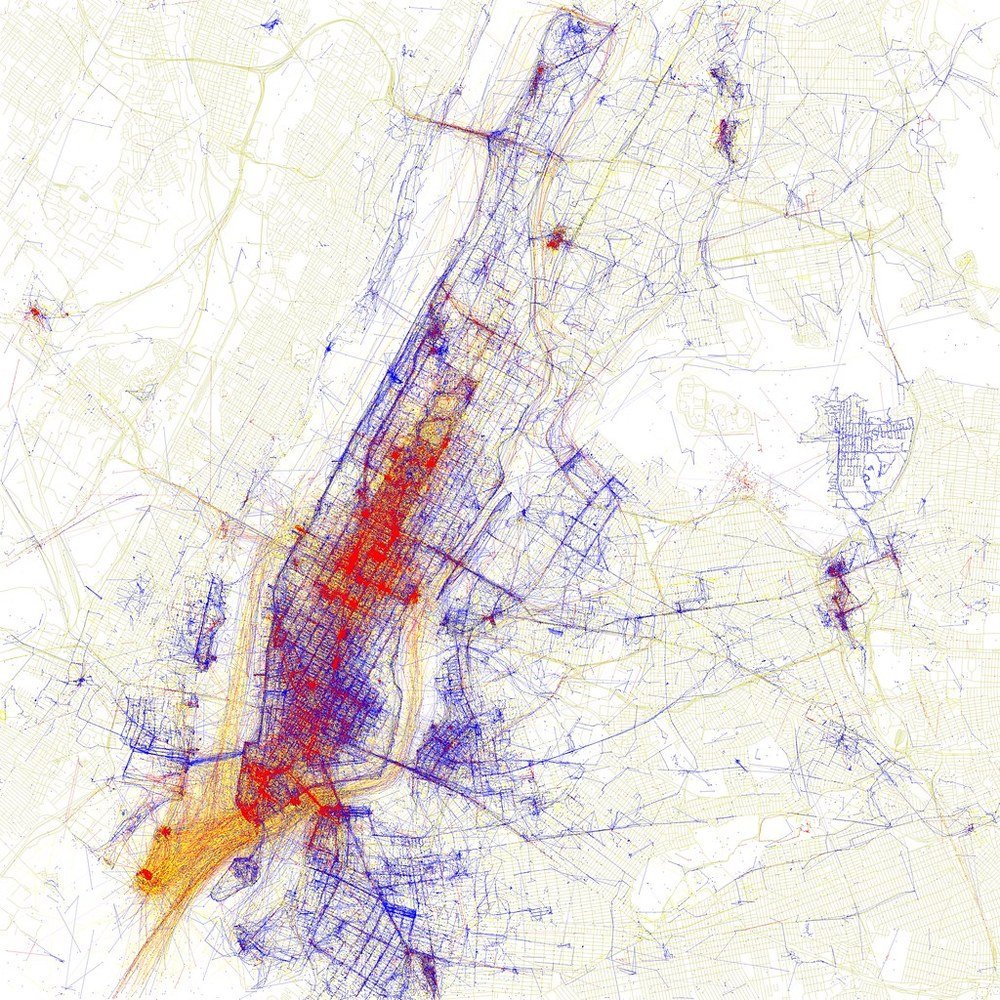
With so much data I could do fun queries. Like where do the diaspora of Chinese, Korean, French and Dutch people live?
Where do 🇨🇳 Chinese, 🇰🇷 Korean, 🇫🇷 French and 🇳🇱 Dutch immigrants (and diaspora) have their own neighborhoods around the world? pic.twitter.com/8G5dgziile
— Pietz @ 🇺🇸 (@levelsio) July 15, 2017
With crowdsourced data, generally the more you have of it, the more accurate your interpretations of it become.
Monetization
A few ideas I have and tried. I wanted to sell posters:
But I didn’t sell a single one. I tried selling local business ads:
✨ Monetization: businesses can claim a city's Hoodmaps and add their text ad. Think car dealerships, restaurants etc. pic.twitter.com/yeSyPVsfku
— Pietz @ 🇺🇸 (@levelsio) July 7, 2017
But I didn’t sell a single ad.
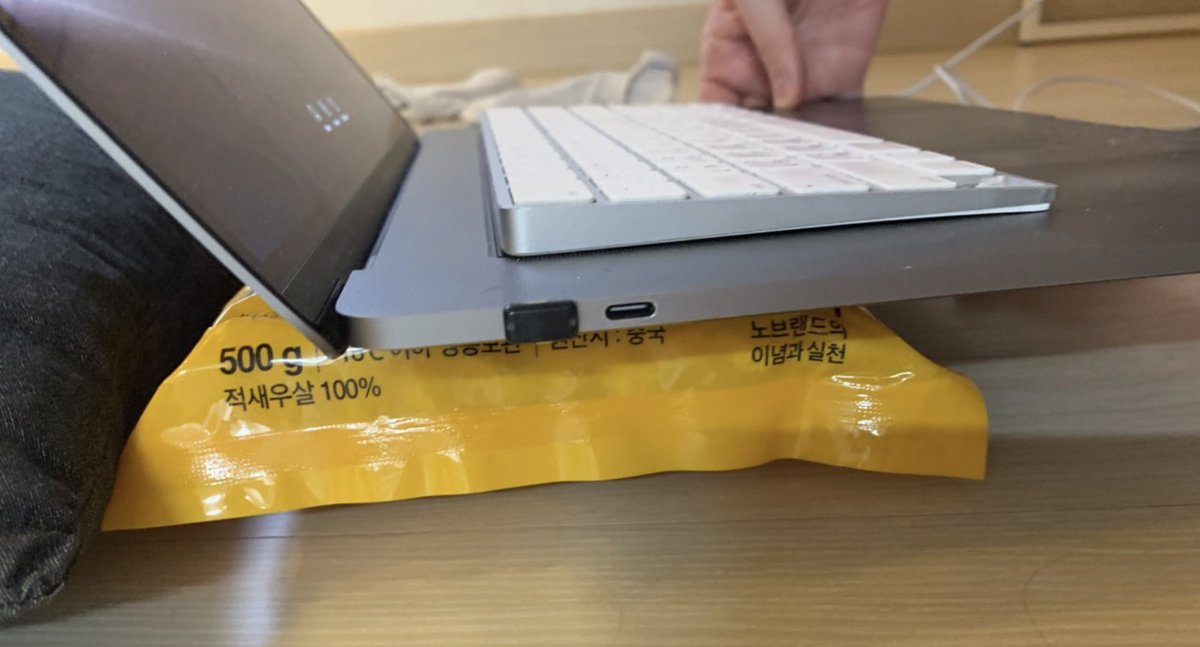
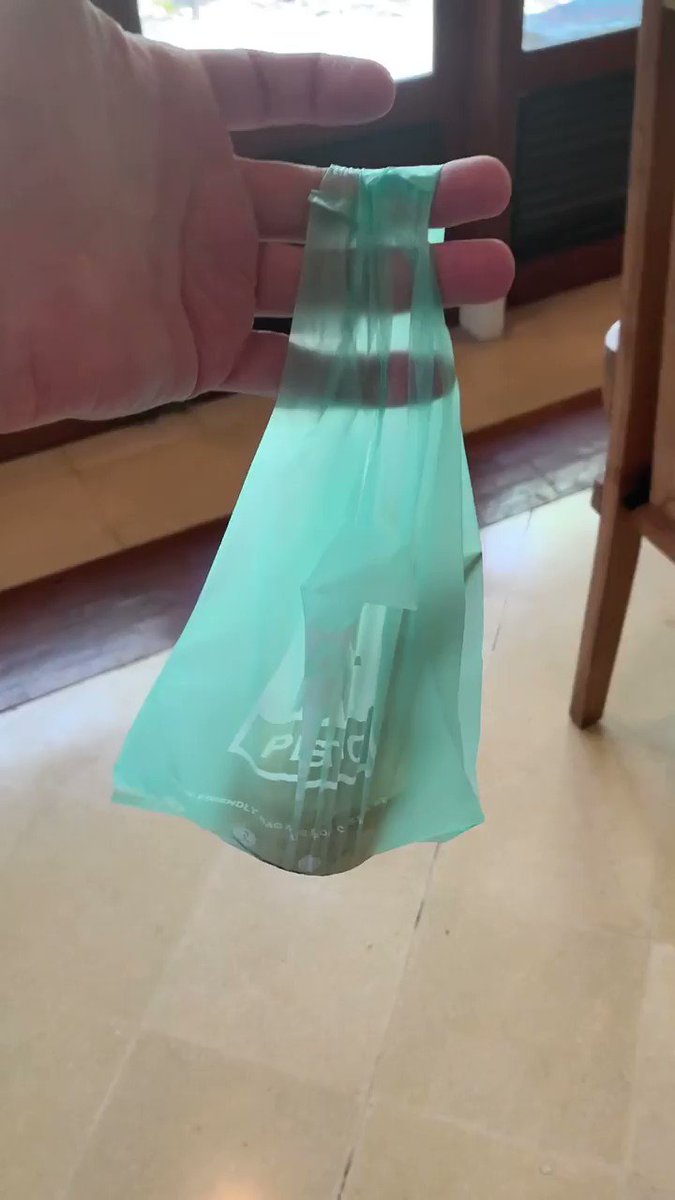
I have one more idea to test. I want to sell laminated cardboard maps of a city that people can draw on after seeing this:
✏️ Found an IRL hoodmap in my Seoul guesthouse. Great possible market 📍t.co/ecFwXScPgv @levelsio pic.twitter.com/jb7fMn4jpm
— Shane Reustle (@reustle) July 20, 2017
Think Airbnb’s etc. You hang up a little map, and the host (or guest) can draw on it with a marker about the area:
I’m still not sure if I want to do that though as it’ll be somehwat physical. I’d prefer finding a business model that’s software-based here. Selling the data would be cool, but I have no idea where to even start. Let me know if you have a concrete idea.
Conclusion
Validated
It’s early to make any big conclusions. But I know that the problem is real. People want to know where to go in a city. And I validated that using collective knowledge for that in a visual way is a solution. The challenge now is how do you make this site as mainstream as, e.g. WikiVoyage? I’m not sure yet, but I’ll keep improving the app while monitoring traffic. For now it’s looking good. Generally there’s 25 to 75 people on the site at any moment and it’s been 2 weeks!
Building in public
This was my first time 100% building in public. It was stressful because everyone was watching and I was honestly quite convinced it wouldn’t even turn out to be anything people would use. But it went much better than expected. The fun part of building it in public was that with every point where I was stuck I had 100 people watching with me to help solve a problem. It also made me accountable, I couldn’t slack off, there was people watching me build. Even better, just the fact that I built it in public is unique and is marketing (it worked, because you’re reading until here!).
It hurts
All I’d like to say is, you can do it too. I have some unfair advantages now (like a big Twitter following), but don’t let that stop you. It takes sacrifice though: building in public on a livestream where you can fail in front of hundreds of people, I stayed up for 36 hours to keep the server up and organize the launch. I spent the last 2 weeks every day working to keep the app simply running. This isn’t a day job. It’s highly concentrated effort where every detail needs to be perfect.
After I click publish on this post, I’ll take a few weeks off to recover.
But it’s worth it!
I hope I didn’t bore you too much and inspired you a bit with this way too long blog post. Go ship today!
P.S. I'm on 𝕏 too if you'd like to follow more of my stories. And I wrote a book called MAKE about building startups without funding. See a list of my stories or contact me.
To read every new post (including blogs from 𝕏) in full in your inbox, join 14,324 subscribers
You can unsubscribe easily and I promise to never spam you